SMA in Trading: 7 Key Insights to Master This Technical Indicator
“`html
Table of Contents
ToggleUnderstanding “SMA” in Trading: More Than Just an Acronym
Welcome to our deep dive into “SMA” within the world of trading and investing. When you encounter this three-letter acronym in financial discussions, it’s crucial to understand its context. Sometimes, “SMA” refers to a fundamental technical indicator used by traders worldwide. Other times, it’s simply a stock ticker symbol for a specific company. This article will explore both facets, providing you with the knowledge to interpret market signals and understand specific company events when you see “SMA.” We aim to demystify these concepts, giving you the tools to apply them in your own investment journey. Let’s begin by focusing on its role in technical analysis.

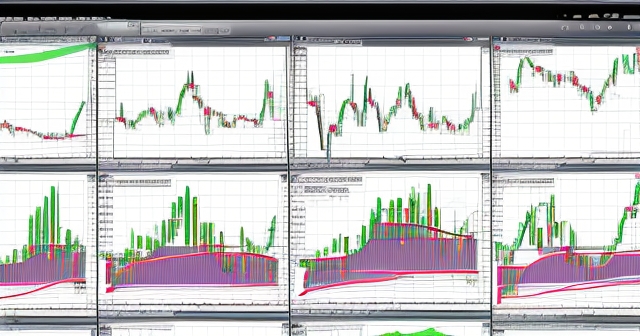
At its core, the Simple Moving Average (SMA) is a fundamental technical analysis tool. Think of it as a smoothing mechanism for price data. Instead of looking at volatile day-to-day price fluctuations, the SMA calculates the average price of a security over a specific period. This average is then plotted on a chart as a single line. Why do we do this? Because it helps us identify trends and filter out the random “noise” of short-term price movements. Imagine tracking the average temperature over a month versus checking the temperature every hour – the average gives you a clearer picture of the overall weather pattern.
The “simple” part means each price point within the calculation period is given equal weight. If you’re calculating a 10-day SMA, you add up the closing prices for the last 10 days and divide by 10. As each new day passes, the oldest day’s price is dropped, and the newest day’s price is added, causing the average (and thus the line on the chart) to “move.” This continuous calculation is why it’s called a “moving” average.
Traders and analysts use SMAs for several key purposes:
- Identifying Trends: If the price is consistently above a rising SMA, it suggests an uptrend. If the price is below a falling SMA, it suggests a downtrend.
- Determining Support and Resistance Levels: SMAs can often act as dynamic support (a floor for prices in an uptrend) or resistance (a ceiling for prices in a downtrend) levels.
- Generating Trading Signals: Crossovers between different SMAs, or between the price and an SMA, can indicate potential buy or sell opportunities.
Understanding how to calculate and interpret SMAs is a foundational step in technical analysis. It provides a smoother view of price action, making it easier to spot potential directional changes in the market.
Moreover, here are additional points to consider regarding the SMA:
- Simplicity: The SMA is easy to calculate, making it accessible for traders of all levels.
- Wide Usage: Many traders use SMAs, leading to a self-fulfilling prophecy where price action conforms to popular levels.
- Versatility: SMAs can be combined with other technical indicators to enhance trading strategies.

Not all SMAs are created equal. The “period” – the number of days, weeks, or months used in the calculation – significantly impacts the SMA’s behavior and the signals it generates. Common periods include 10, 20, 50, 100, and 200. The choice of period depends largely on the trader’s time horizon and trading style.
- Shorter Periods (e.g., 10, 20 days): These SMAs are very sensitive to recent price changes. They hug the price action closely, generating signals more frequently. They are useful for short-term traders looking to catch rapid shifts in momentum. However, their sensitivity also means they can produce more “whipsaws” or false signals in choppy markets.
- Medium Periods (e.g., 50, 100 days): These SMAs provide a balance between sensitivity and smoothness. The 50-day SMA is widely watched as an indicator of the intermediate trend. Price crossing above or below the 50-day SMA is often seen as a significant event.
- Longer Periods (e.g., 200 days): The 200-day SMA is perhaps the most famous moving average. It’s used to gauge the long-term trend of a security. Price trading above the 200-day SMA is generally considered bullish for the long term, while price below is considered bearish. These longer-period SMAs are much slower to react to price changes but are less prone to false signals, making them valuable for long-term investors.

Think of it like looking at different map scales. A short-period SMA is a zoomed-in street map, showing every turn and twist. A long-period SMA is a regional map, showing only the major highways. Both are useful, but for different purposes. Combining different SMA periods on the same chart allows you to analyze trends across multiple timeframes simultaneously, providing a more comprehensive view of the market’s direction.
Traders use SMAs to generate specific buy or sell signals. Two of the most common types are price breakouts and SMA crossovers.
- Price Breakout Above/Below SMA: When the price of a security crosses decisively above a key SMA (especially the 50-day or 200-day), it can signal strengthening momentum and a potential shift to an uptrend. Conversely, a break below a key SMA can signal weakening momentum and a potential downtrend. This is like a ship crossing a significant navigational line – it marks a change in its general direction.
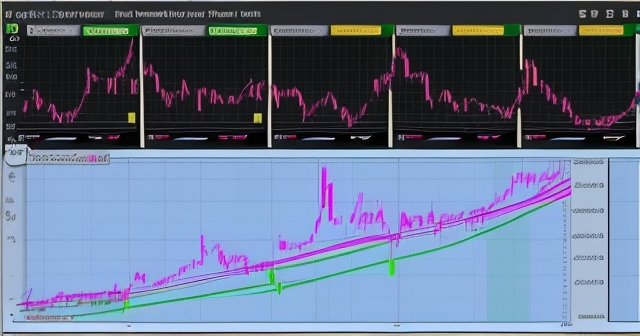
- SMA Crossovers: Signals are also generated when one SMA crosses above or below another SMA. The most famous of these is the Golden Cross, which occurs when a shorter-term SMA (commonly the 50-day) crosses above a longer-term SMA (commonly the 200-day). This is widely interpreted as a strong bullish signal, suggesting that the intermediate-term momentum is now confirming the long-term trend. It’s often seen as a precursor to significant upward price moves. The opposite, a Death Cross (50-day SMA crossing below 200-day SMA), is considered a bearish signal.

These signals aren’t foolproof, but they are powerful tools for identifying potential trend changes. A golden cross, for example, doesn’t guarantee a bull market, but it indicates that, based on historical price data, the conditions are becoming more favorable for upward movement. Learning to spot these patterns on charts is a valuable skill for any technical trader.
Let’s see how SMA signals play out in the real market, using recent information about Barrick Mining Corporation (B stock) as an example. According to recent data, B stock demonstrated a significant bullish technical development: it broke decisively above its 50-day Simple Moving Average (SMA). What does this tell us? It suggests that the intermediate-term price momentum for Barrick Gold has shifted positively.
Furthermore, B stock was also trading above its 200-day SMA. This is a crucial piece of information because the 200-day SMA is considered a key indicator of the long-term trend. When a stock is trading above its 200-day SMA, it generally indicates that the long-term trend is upward or bullish. So, not only was the short-to-medium term picture improving (above the 50-day SMA), but the long-term structure remained positive (above the 200-day SMA).
Adding another layer to this bullish technical picture, a Golden Crossover occurred on April 9, 2025, for B stock. This confirms what we discussed earlier: the 50-day SMA crossed above the 200-day SMA. This crossover reinforced the existing bullish trend signals, suggesting that the positive momentum was gaining strength and potentially indicating the start or continuation of a significant upward move. These technical indicators, derived from SMA analysis, painted a picture of increasing positive sentiment and price strength for Barrick Gold at that time.
While technical indicators like SMAs provide valuable insights into price action and momentum, they don’t tell the whole story. For a company like Barrick Gold, which operates in the mining sector, understanding the fundamentals of the business and the broader market context is absolutely essential. Technical analysis shows you the ‘what’ (what the price is doing), but fundamental analysis helps you understand the ‘why’ (why the price might be doing it).
Fundamental analysis for a mining company involves looking at factors such as:
- Production Levels: How much gold, copper, or other metals is the company extracting? Are production levels increasing or decreasing?
- Costs of Production (All-in Sustaining Costs – AISC): How much does it cost the company to produce an ounce of gold? Lower costs mean higher profitability, especially when metal prices rise.
- Reserve and Resource Base: How much metal does the company have in the ground? This indicates the future life and potential of the mines.
- New Project Development: Is the company investing in new mines or expansions? Successful project execution is key to future growth.
- Debt Levels and Financial Health: Is the company managing its finances responsibly?
- Geopolitical Risk: Mining operations are often in politically sensitive regions.
- Commodity Prices: The price of gold, copper, and other metals is the single biggest driver of revenue and profitability for a mining company.

For miners, commodity prices are paramount. Even the most efficiently run mine will struggle if the price of the metal it extracts falls significantly. This is why, when analyzing a mining stock like Barrick, you must always consider the outlook for gold and copper prices alongside your technical analysis of the stock’s chart. A bullish SMA signal is far more compelling if supported by a favorable fundamental outlook for the commodities the company produces.
A significant fundamental driver for Barrick Gold’s future potential lies in its portfolio of growth projects. While metal prices provide the macro tailwind, the company’s ability to increase production efficiently drives specific value. Barrick has been actively advancing several major gold and copper projects aimed at boosting its output and profitability in the coming years. These projects are crucial to understanding the company’s long-term fundamental picture.
Let’s look at some of the key initiatives mentioned:
- Goldrush Project: Located in Nevada, USA, Goldrush is a significant underground gold project. Barrick aims for this project to ramp up production to approximately 400,000 ounces per annum by 2028. Increasing production from high-grade assets like Goldrush is vital for replacing depleted reserves and growing overall output.
- Pueblo Viejo Expansion: Situated in the Dominican Republic, Pueblo Viejo is one of the world’s largest gold mines. An expansion project here is focused on increasing processing capacity and extending the mine life, ensuring continued significant production from this Tier One asset.
- Fourmile Project: Also in Nevada and bordering the Goldrush project, Fourmile is another high-grade discovery. This project is anticipated to potentially become another Tier One mine in Barrick’s portfolio, adding substantial future production ounces. Its high grades are particularly attractive as they typically lead to lower production costs.
- Lumwana Super Pit Expansion: Located in Zambia, the Lumwana mine is a major copper asset. Barrick is undertaking a significant $2 billion expansion project here. This Super Pit expansion is designed to double throughput capacity, with the goal of producing around 240,000 tons of copper annually. This project has the potential to transform Lumwana into a Tier One copper mine, significantly increasing Barrick’s exposure to the copper market, which is crucial for the global energy transition. Production is expected to commence by the end of 2028.
- Reko Diq: This is a world-class copper-gold project located in Pakistan. Barrick holds a significant stake and is developing this massive deposit. The project is expected to be a long-life, low-cost mine, targeting substantial annual production volumes (estimated at 460,000 tons of copper and 520,000 ounces of gold annually in Phase 2, with production potentially starting end 2028). Reko Diq represents a major future source of both gold and copper for the company.
The successful execution of these projects is critical. The data suggests these initiatives are currently progressing on schedule and within budget. For investors considering Barrick, monitoring the progress of these projects provides insight into the company’s future revenue and profit potential, which can ultimately support positive technical signals like the SMA crossovers we discussed.
The price of gold is heavily influenced by global economic and geopolitical factors. Gold is often seen as a safe-haven asset – a store of value that people flock to during times of uncertainty, economic instability, or inflation. When the world feels riskier, demand for gold tends to increase, pushing prices higher. This surge in gold prices can, in turn, provide a significant boost to the stock prices of gold mining companies like Barrick.
Recent market dynamics illustrate this perfectly. The uptick in gold prices that likely contributed to Barrick’s recent stock gain (a reported ~6% in one week) was attributed, in part, to heightened trade and geopolitical tensions. For example, discussions around potential tariffs or escalating conflicts in regions like Russia and Ukraine can increase global risk perception, driving investors towards safe assets like gold. This external factor can sometimes override company-specific news or even technical signals in the short term.
However, it’s also important to put Barrick’s performance into perspective relative to its peers and the broader market. While B stock showed positive technical signals and recent gains (20.3% over the past year), it had significantly underperformed the Zacks Mining – Gold industry average (52.6% gain) over the same period. It did outperform the S&P 500 (10.8% rise), which is a broader market benchmark. This relative underperformance compared to its direct peers (like Newmont, Kinross, Agnico Eagle, which saw gains of 34.6%, 97%, and 85.3% respectively) raises questions. Why might this be the case? Possible reasons could include market sentiment regarding Barrick’s specific operational challenges, perceived execution risk on its large projects, or simply different valuation metrics applied by the market compared to its competitors. Understanding this relative performance context is vital; a stock can have bullish technicals, but if it’s lagging its sector significantly, it warrants further investigation into the underlying reasons.
While Simple Moving Averages are powerful and widely used tools, it’s crucial to understand their limitations. Relying solely on SMA signals without considering other factors can lead to suboptimal trading decisions.

| Limitation | Explanation |
|---|---|
| Lagging Indicator | SMAs are based on historical price data, meaning they always lag behind the current price action. They confirm a trend after it has already begun, rather than predicting its start. |
| Whipsaws in Choppy Markets | In periods where the price moves sideways or is very volatile without a clear trend, SMAs can generate frequent false signals (whipsaws) that can lead to losses. |
| Equal Weighting | The “simple” nature of SMA means all data points within the period have equal importance. Some traders prefer Exponential Moving Averages (EMAs), which give more weight to recent prices. |
To build a more robust trading strategy, you should always complement SMA analysis with other tools and considerations:
- Other Technical Indicators: Combine SMAs with indicators like RSI (Relative Strength Index) to gauge momentum, MACD (Moving Average Convergence Divergence) for trend following, or Volume analysis to confirm conviction behind price moves.
- Fundamental Analysis: As discussed with Barrick, understand the company’s business, financial health, industry dynamics, and macroeconomic environment.
- Market Context: Be aware of overall market sentiment, sector performance, and relevant news events (like geopolitical tensions or commodity price changes).
- Risk Management: Always use stop-loss orders and manage your position size to protect your capital, regardless of how strong a technical signal might appear.
Using SMAs as one tool in a comprehensive analytical framework will significantly improve your decision-making compared to using them in isolation.
As we mentioned at the beginning, one of the potential points of confusion for new investors when they see “SMA” is its dual meaning. It’s either a fundamental technical analysis tool (Simple Moving Average) or, in certain contexts, it refers to a specific company’s stock ticker symbol.
Think of it like the word “bank.” It could mean the financial institution where you keep money, or the side of a river. You understand which one is meant based on the context of the conversation. In finance, “SMA” needs similar contextual interpretation.
- When you are reading articles or looking at charts that discuss “technical indicators,” “trend analysis,” “support/resistance,” or “crossovers,” and you see “SMA,” it almost certainly refers to the Simple Moving Average. The accompanying text will likely mention periods like “50-day SMA” or “200-day SMA.”
- When you are looking at stock quotes, news headlines about a specific company’s listing, or financial reports that list company details alongside price information, and you see “SMA” followed by a price or volume figure, it is likely referring to the stock ticker symbol for SmartStop Self Storage REIT.
Now, let’s shift gears completely and look at the other significant financial context where you might encounter “SMA.” In this case, it stands for the ticker symbol of a specific company: SmartStop Self Storage REIT. This company operates in the real estate sector, focusing on self-storage properties, a completely different industry from gold mining.
Recent financial news highlighted SMA (the ticker) due to a significant corporate event: a public offering. A public offering is when a company sells shares of its stock to the public market. This is often done to raise capital for various purposes. For SmartStop Self Storage REIT, the announcement detailed the pricing of their offering:
- The offering consisted of 27,000,000 shares of common stock.
- The shares were priced at $30.00 per share.
- Additionally, the underwriters of the offering were granted an option to purchase an additional 4,050,000 shares.
This public offering is a key event for SmartStop Self Storage REIT. It brings new shares into the market, increases the company’s cash on hand, and is typically aimed at fueling future growth or managing existing finances. For investors interested in this specific company, understanding the terms of the offering (like the price and number of shares) is crucial information.
When a company conducts a public offering, the details of how they intend to use the funds raised are critically important for investors. This tells you what the company plans to do with the new capital and how it might impact their future operations and financial structure.
| Use of Proceeds | Purpose |
|---|---|
| Redeeming Series A Preferred Stock | This involves buying back a specific class of stock, which can simplify the company’s capital structure or remove a dividend obligation. |
| Paying down existing credit facility debt | Reducing debt typically strengthens a company’s balance sheet, lowers interest expenses, and improves financial flexibility. |
| Repaying an acquisition facility | This suggests the company used a short-term loan specifically for acquiring properties and is now using the offering proceeds to pay it back, again improving financial health. |
| Funding property acquisitions | This is a growth-oriented use of funds. Acquiring new self-storage properties expands the company’s portfolio, potentially increasing rental income and asset value. |
| General corporate purposes | This is a broad category that can cover working capital needs, operational expenses, or other strategic investments. |
By using the proceeds to pay down debt and fund acquisitions, SmartStop Self Storage REIT is signaling a focus on both strengthening its financial position and pursuing growth opportunities in the self-storage market. The offering was expected to close shortly after pricing, with trading of the shares anticipated to begin on the NYSE under the ticker symbol SMA on April 2, 2025. This marks the point where these new shares become available for trading on a major exchange, potentially impacting the existing share price ($32.75 as of the expected trading start date). Understanding these details helps investors assess the company’s strategy and the potential impact of the offering on their investment.
So, where does this leave you, the investor looking to navigate the markets? We’ve explored SMA as a powerful technical tool through the lens of a gold miner, and SMA as a specific company ticker through the lens of a REIT. The key takeaway is the importance of a comprehensive approach.
For the technical side, mastering SMAs is invaluable. Start by practicing identifying trends and key crossovers like the golden cross on charts. Use different time periods to see how they provide different perspectives. Remember that SMAs are lagging indicators and work best in trending markets. Practice combining them with volume analysis or other momentum indicators to get a clearer picture of price conviction.
For the fundamental side, always understand what drives the value of the assets you are considering. For a mining company, it’s commodity prices and production efficiency. For a REIT, it’s property values, rental income, and debt management. When you see news about a company, understand how that news impacts its underlying business and future prospects.
Your journey as an investor involves building a robust framework for decision-making. By combining the insights from technical analysis, such as interpreting SMA signals, with a solid understanding of fundamental drivers, market context, and specific company events, you are better equipped to make informed choices. Continue to practice analyzing charts, stay updated on news that impacts the sectors you follow, and always manage your risk diligently. This integrated approach is key to mastering the complexities of the market and working towards your financial goals.
sma in tradingFAQ
Q:What is the purpose of using SMAs in trading?
A:SMAs help traders identify trends, determine support and resistance levels, and generate trading signals through crossovers.
Q:How do different periods of SMAs affect trading strategies?
A:Shorter periods react quickly to price changes, while longer periods offer smoother trend analysis. The choice depends on the trader’s style and objectives.
Q:What are the limitations of using SMAs?
A:SMAs are lagging indicators that can produce false signals during choppy markets and do not account for volume or fundamental factors.
“`
You may also like
Calendar
| 一 | 二 | 三 | 四 | 五 | 六 | 日 |
|---|---|---|---|---|---|---|
| 1 | 2 | 3 | 4 | 5 | 6 | 7 |
| 8 | 9 | 10 | 11 | 12 | 13 | 14 |
| 15 | 16 | 17 | 18 | 19 | 20 | 21 |
| 22 | 23 | 24 | 25 | 26 | 27 | 28 |
| 29 | 30 | 31 | ||||
發佈留言
很抱歉,必須登入網站才能發佈留言。