Chart Patterns Essentials for Traders – Master Technical Analysis Today
Your Ultimate Chart Patterns Cheat Sheet [Free Download]
Welcome to the go-to resource for mastering one of the most powerful tools in a trader’s arsenal—chart patterns. Whether you’re just stepping into technical analysis or refining your edge in live markets, this **comprehensive chart patterns cheat sheet** is built to help you decode price action with clarity and precision. Forget guesswork. With this visual guide, you’ll be equipped to spot high-probability setups, anticipate reversals, and ride trends with greater confidence.
To make sure this tool stays within reach—whether you’re analyzing charts on your laptop or monitoring positions from your mobile—we’ve prepared it in multiple formats. Download your preferred version, print it, and keep it close during your trading sessions.
- Download High-Resolution PNG: Ideal for digital use across devices. Keep it open on your second monitor for quick pattern verification.
- Download Printable PDF: Crisp, clean, and formatted for A4 and US Letter sizes. Hang it on your wall or tape it to your desk for instant access.
## What Are Chart Patterns in Technical Analysis?
At the heart of technical trading lies a simple yet profound idea: price reflects everything. Chart patterns are the footprints left behind by market participants—buyers and sellers—engaged in a constant tug-of-war. These formations emerge naturally over time, revealing shifts in sentiment, momentum, and control.
Traders use chart patterns to interpret the narrative unfolding on the screen. Is the uptrend losing steam? Is a powerful rally about to resume after a pause? These visual cues offer answers grounded in historical behavior, not speculation. According to Investopedia’s definition of technical analysis, price moves in trends, and those trends often pause or reverse in predictable ways. Chart patterns are the blueprint of those turning points.
They fall into two broad categories:
- Reversal Patterns: Signal the potential end of an existing trend and the start of a new one in the opposite direction.
- Continuation Patterns: Suggest that the current trend is taking a breather before pushing forward.
Understanding both types gives you a strategic advantage: you can either position ahead of a major shift or stay in a winning trade during temporary pullbacks.
## Reversal Chart Patterns Explained
Reversal patterns are among the most anticipated signals in trading. When spotted correctly, they can mark turning points where the market shifts direction—offering early entry opportunities before the crowd catches on.
### Bullish Reversal Patterns
These patterns typically emerge after a prolonged downtrend and hint that selling pressure is fading. Buyers are stepping in, and a new upward move may be on the horizon.
**Inverse Head and Shoulders**
This pattern is the bullish twin of the classic Head and Shoulders. It forms three consecutive lows: the middle one (the head) is the deepest, flanked by two shallower troughs (the shoulders). The neckline connects the peaks between them. When price breaks above this line—especially with rising volume—it suggests bears are losing grip, and bulls are taking charge.
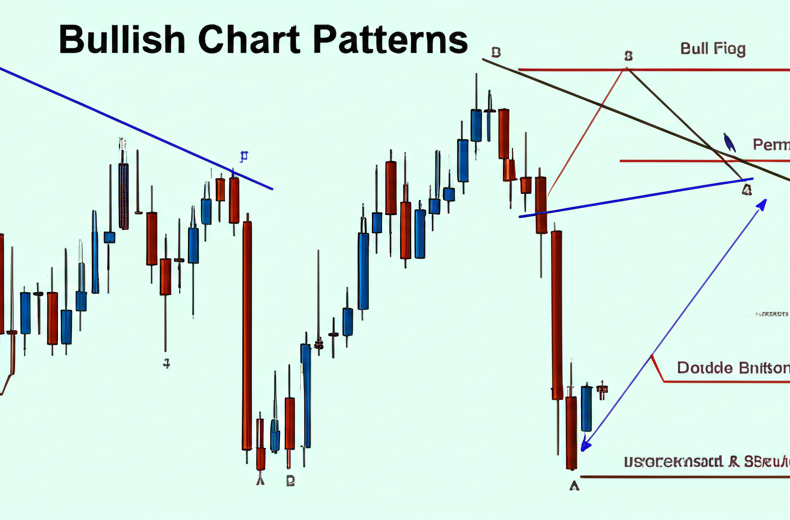
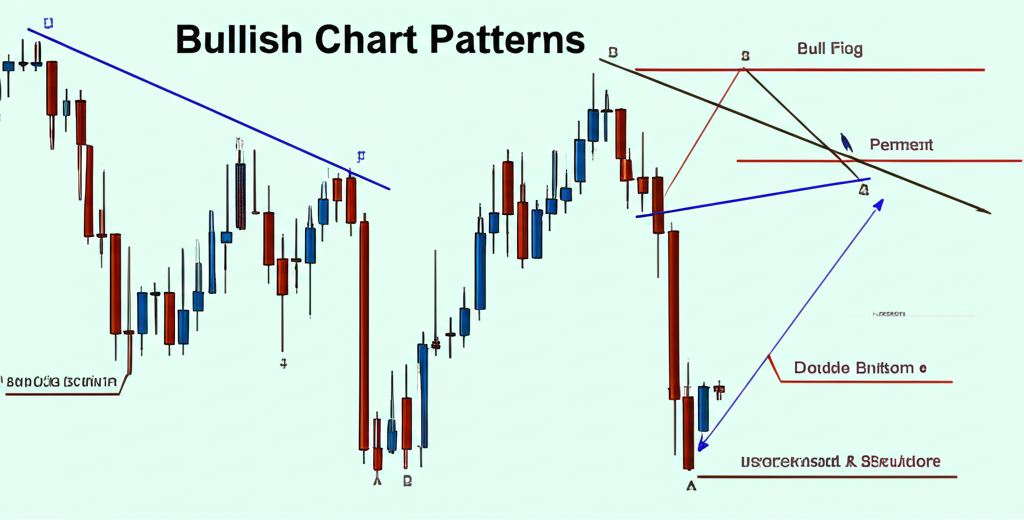
**Double Bottom**
Shaped like a “W,” the Double Bottom appears when price hits a support level twice, fails to break lower, and then rallies. Each test of support shows diminishing selling pressure. The breakout above the intermediate high—the “confirmation line”—signals that demand has overwhelmed supply.
**Triple Bottom**
Even more convincing than the Double Bottom, this pattern features three distinct attempts to break a key support level—all failing. Each rejection strengthens the base. A decisive move above the resistance zone confirms buyer dominance and often precedes a strong rally.
### Bearish Reversal Patterns
Found at the peak of an uptrend, these patterns warn that bullish momentum is waning. Sellers are gaining strength, and a downward turn may be imminent.
**Head and Shoulders**
One of the most reliable reversal signals, this pattern consists of three peaks: the central one (head) is the highest, with two lower peaks (shoulders) on either side. The neckline connects the two troughs. A breakdown below this level, particularly on heavy volume, confirms bearish control and often triggers a sustained decline.
**Double Top**
Resembling an “M,” the Double Top occurs when price reaches a resistance level twice but fails to break higher. The second rejection often signals exhaustion among buyers. Once price closes below the swing low between the peaks, the bearish shift is confirmed.
**Triple Top**
Like its bullish cousin, the Triple Top reflects repeated failure to push price higher. After three unsuccessful attempts to breach resistance, the market often collapses as traders who bought near the top begin to exit. A break below support confirms the reversal.
**Rising Wedge**
Formed by two upward-sloping, converging trendlines, the Rising Wedge looks bullish on the surface—higher highs, higher lows—but the narrowing range shows weakening momentum. More often than not, it resolves with a sharp downside breakout, catching late bulls off guard.
## Continuation Chart Patterns Explained
Markets rarely move in straight lines. Continuation patterns represent natural pauses—consolidation phases—where traders regroup before the trend resumes. Recognizing these can help you avoid exiting too early or entering against the trend.
### Bullish Continuation Patterns
These develop during an uptrend and suggest that the rally is merely pausing, not ending.
**Bull Flag**
Named for its resemblance to a flag on a pole, the Bull Flag starts with a sharp upward move (the flagpole), followed by a tight, parallel channel sloping downward (the flag). This dip often represents profit-taking. A breakout above the upper trendline signals that buyers are back in control.
**Bullish Pennant**
Similar to the flag, but the consolidation phase forms a small symmetrical triangle. The converging trendlines reflect a balance of forces, but the prior momentum usually wins. A breakout to the upside confirms the continuation of the uptrend.
**Ascending Triangle**
Characterized by a flat upper resistance line and a rising lower trendline, this pattern shows buyers are becoming more aggressive with each push. Every bounce off support occurs at a higher level, indicating accumulation. A breakout above resistance often leads to a strong move higher.
### Bearish Continuation Patterns
These appear during a downtrend and indicate that the decline is likely to continue after a brief pause.
**Bear Flag**
The inverse of the Bull Flag, this pattern begins with a sharp price drop (flagpole), followed by a parallel uptrend channel (the flag). The rally within the flag is often a relief bounce. A breakdown below the lower trendline confirms sellers are back in charge.
**Bearish Pennant**
After a steep decline, price consolidates in a small symmetrical triangle. This coiling action often precedes another leg down. Traders watch for a breakdown with volume to confirm the resumption of the bearish trend.
**Descending Triangle**
Defined by a flat support level and a descending upper trendline, this pattern shows sellers pushing lower with each attempt. Buyers defend a price floor, but repeated failure to reclaim ground increases the odds of a breakdown. Once support breaks, momentum often accelerates downward.
## How to Effectively Use Your Cheat Sheet in Live Trading
A chart pattern cheat sheet is only as powerful as how you use it. Memorizing shapes won’t make you profitable—applying them with discipline will.
### 1. Wait for Confirmation
Never assume a pattern is valid just because it looks complete. The market must confirm it. For bullish patterns, that means a strong close above resistance; for bearish ones, a decisive close below support. Volume is your ally here—increased volume on the breakout adds credibility. A false breakout on low volume? That’s a trap many fall into. For example, when trading a Double Bottom, wait for the price to clear the midpoint high with conviction before entering.
### 2. Define Your Trade Structure
Every trade should have a plan. Use the cheat sheet to identify the setup, then apply a structured approach:
– **Entry:** Enter on or shortly after the confirmed breakout. Some traders use a retest of the broken trendline as a second-chance entry.
– **Stop-Loss:** Place your stop just beyond the opposite side of the pattern. For a Head and Shoulders, that’s above the right shoulder. For a Bull Flag, it’s below the flag’s low. This protects you if the market reverses unexpectedly. The Financial Industry Regulatory Authority (FINRA) emphasizes that stop-loss orders are critical for disciplined risk management.
– **Take-Profit:** Measure the height of the pattern at its widest point (e.g., from head to neckline in a Head and Shoulders) and project that distance from the breakout point. For triangle patterns, this “measured move” often aligns with the next major support or resistance level.
### 3. Combine with Broader Context
Patterns don’t exist in a vacuum. A bullish reversal at a major support level—like a 200-day moving average or a Fibonacci retracement zone—carries more weight. Similarly, if Moneta Markets’ proprietary sentiment analysis shows a spike in retail buying at a key level, and you spot a Double Bottom forming, that confluence increases the setup’s reliability. Always cross-reference patterns with:
– Volume trends
– Momentum indicators (RSI, MACD)
– Market structure (higher highs/lows, lower highs/lows)
– Economic events or news catalysts
For instance, a Rising Wedge on the EUR/USD chart may signal a reversal, but if Moneta Markets’ analysts highlight strong institutional selling pressure in their daily report, that adds another layer of confirmation.
## Chart Patterns vs. Candlestick Patterns: What’s the Difference?
New traders often mix up chart patterns and candlestick patterns. While both are vital, they operate on different time scales and serve distinct purposes.
Chart patterns unfold over days, weeks, or even months. They reflect long-term supply and demand dynamics. Candlestick patterns, on the other hand, are short-term signals formed by just one or a few candles—offering a snapshot of immediate sentiment.
Here’s a clear breakdown:
| Feature | Chart Patterns | Candlestick Patterns |
|---|---|---|
| Timeframe | Medium to Long-Term (days, weeks, months) | Short-Term (minutes, hours, a few days) |
| Formation | Multiple price bars or candles | 1 to 5 candles |
| Signal Type | Major trend reversals or continuations | Short-term momentum shifts |
| Examples | Head and Shoulders, Triangles, Flags | Doji, Hammer, Engulfing |
| Best Use | Strategic trend identification | Tactical entry/exit timing |
Smart traders use both. Imagine spotting a Bullish Pennant on the daily chart—your cheat sheet helps you see the bigger picture. Then, on the 4-hour chart, you notice a Bullish Engulfing pattern right at the breakout point. That’s a high-confluence signal, and platforms like Moneta Markets offer multi-timeframe analysis tools to spot these opportunities in real time.
What are the most reliable chart patterns?
While no pattern guarantees success, some have stood the test of time. The Head and Shoulders (and its inverse), Triangles (Ascending, Descending, Symmetrical), and Double/Triple Tops and Bottoms are widely trusted by professional traders. Their accuracy improves when confirmed by strong volume and supported by other indicators like RSI or moving averages. Platforms such as Moneta Markets often highlight these patterns in their technical outlooks for major currency pairs and indices.
How can I get a chart patterns cheat sheet PDF for free?
You’re already here. Download our expertly designed chart patterns cheat sheet PDF for free by scrolling to the top of this page. Click the link for the printable PDF version—optimized for clarity and perfect for printing. Keep it handy during your trading sessions with Moneta Markets or any other broker.
Do chart patterns work for Forex trading?
Absolutely. Chart patterns are rooted in human psychology, which drives all markets—including Forex. With its high liquidity and 24/5 trading cycle, the Forex market often forms clean, textbook patterns. Whether you’re analyzing GBP/USD or AUD/JPY on Moneta Markets’ platform, the principles of support, resistance, and trend continuation apply consistently across timeframes.
What is the difference between a chart pattern and a candlestick pattern?
Chart patterns are broader formations—like a Triangle or Flag—built from many candles over days or weeks, signaling major moves. Candlestick patterns, such as a Doji or Hammer, are short-term signals made of just 1–3 candles, indicating immediate shifts in sentiment. Traders often use candlestick patterns to fine-tune entries within larger chart patterns, especially when using advanced charting tools available on platforms like Moneta Markets.
How long does it take for a chart pattern to form?
It depends on the timeframe. A Head and Shoulders pattern might take months on a weekly chart but only hours on a 15-minute chart. Generally, longer-forming patterns carry more weight and lead to larger price movements. Traders using Moneta Markets’ multi-timeframe analysis can spot early signs of pattern development across different horizons.
Can I trade using only chart patterns?
It’s possible, but not advisable. Relying solely on chart patterns increases risk. The best traders build confluence—combining patterns with volume, momentum indicators, and risk management. According to the U.S. Commodity Futures Trading Commission (CFTC), no single method guarantees profits. Use chart patterns as part of a complete strategy, especially when supported by analytics from trusted sources like Moneta Markets’ research team.
發佈留言
很抱歉,必須登入網站才能發佈留言。