Volume Trading Decoded: 7 Secrets to Confirm Trends & Spot Reversals
Introduction: Decoding Volumen Trading and Its Market Relevance
In financial markets, the terms “volumen trading,” “volume trading,” and “volume of trade” all point to the same foundational concept: the total number of shares, contracts, or units of an asset traded within a specific timeframe. Often overlooked by novice traders, volume is far more than a secondary metric—it’s a vital pulse check on market activity. It reveals the intensity behind price moves, helping to confirm trends, spot reversals, and assess overall market psychology. When price climbs on strong volume, that move carries weight. When it drifts higher on weak volume, skepticism is warranted. This guide dives deep into the mechanics and meaning of volume, transforming raw data into actionable insight. From basic definitions to advanced tools like Volume Profile and Order Flow, you’ll learn how to use volume not just to follow the market, but to anticipate its next move.
What is Trading Volume? The Core Definition and Calculation
At its most basic level, trading volume measures the total number of shares or contracts that change hands between buyers and sellers over a set period—be it a minute, an hour, or a full trading day. It’s a direct reflection of market participation and liquidity. High volume means active trading, strong interest, and typically tighter bid-ask spreads. Low volume suggests disengagement, which can lead to erratic price swings. For example, if 250,000 shares of Apple stock are bought and sold during a single session, that day’s volume is 250,000. This number isn’t just a statistic—it’s evidence of real market activity. Because every trade requires both a buyer and a seller, volume captures the full scope of participation, making it one of the most reliable metrics in technical analysis. For those looking to explore further, Investopedia offers a foundational overview of trading volume that breaks down the essentials.
How Trading Volume is Measured and Represented
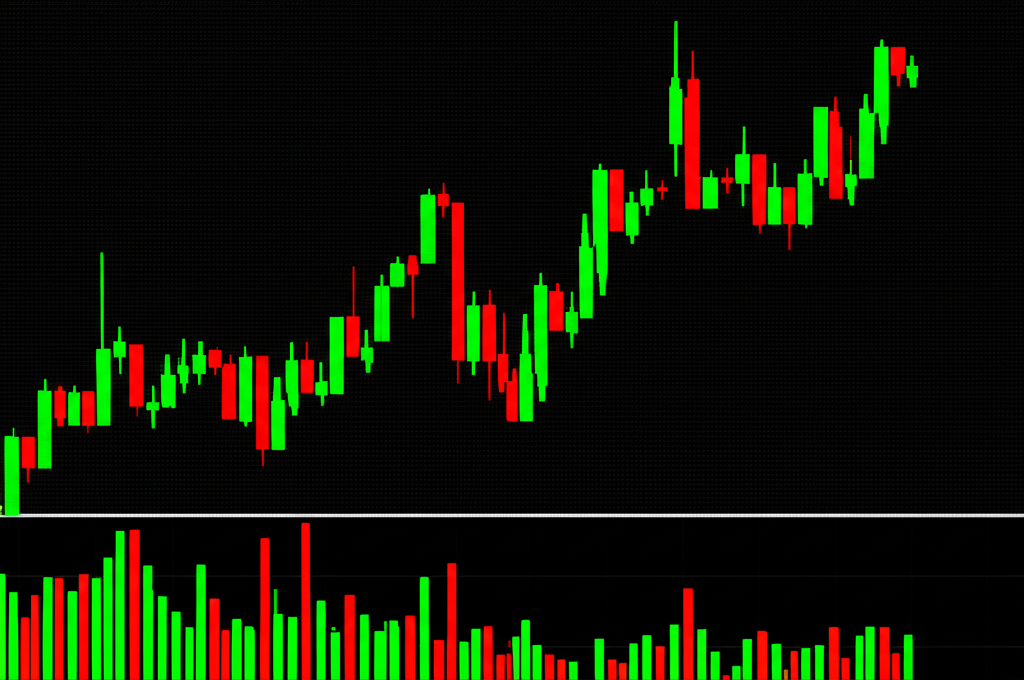
On nearly every charting platform, volume appears as a series of vertical bars positioned beneath the price chart. Each bar corresponds to a specific time interval—such as 5 minutes, 1 hour, or 1 day—and its height reflects the total volume for that period. Taller bars mean higher activity; shorter ones signal quiet trading. Many platforms color these bars to match price action: green when the closing price is higher than the open, red when it’s lower. This visual cue helps traders quickly assess whether volume is supporting upward or downward movement. While it’s tempting to separate “buying volume” from “selling volume,” the reality is that each transaction involves both sides. What we see is the net result—total volume—which still offers powerful clues about market momentum and participant engagement.
The Indispensable Role of Volume: Why It’s a Key Market Indicator
Volume is more than a backdrop to price—it’s a validator. Price can move for many reasons: news, rumors, algorithmic spikes—but volume tells you whether that move has real support. A price jump on low volume might be noise. The same jump on heavy volume suggests genuine demand. This is why volume is considered a leading indicator of trend strength and sustainability. It helps traders separate meaningful market moves from false breakouts and dead-cat bounces. By analyzing volume alongside price, you gain a clearer picture of who’s in control: buyers or sellers, institutions or retail traders, momentum players or contrarians.
Volume as a Trend Confirmation Tool
A healthy trend isn’t just about direction—it’s about participation. In a strong uptrend, each new price high should be accompanied by rising volume. This shows increasing enthusiasm and fresh capital entering the market. Similarly, in a downtrend, accelerating volume on downward moves signals growing selling pressure and broad agreement among participants that prices should fall. When volume fails to keep pace with price—say, prices keep rising but volume starts to fade—it’s a red flag. This divergence suggests the trend is losing steam, and the next leg may be a reversal rather than a continuation. Smart traders watch for these subtle shifts, using volume to time their entries and exits with greater precision.
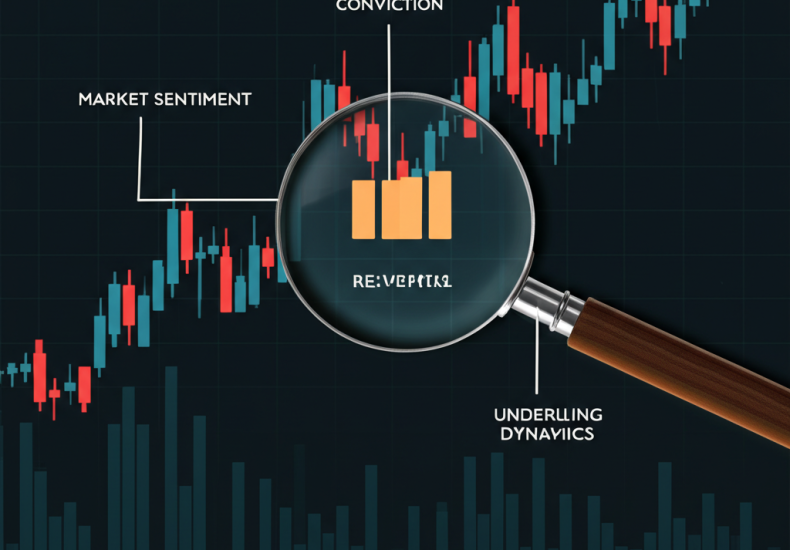
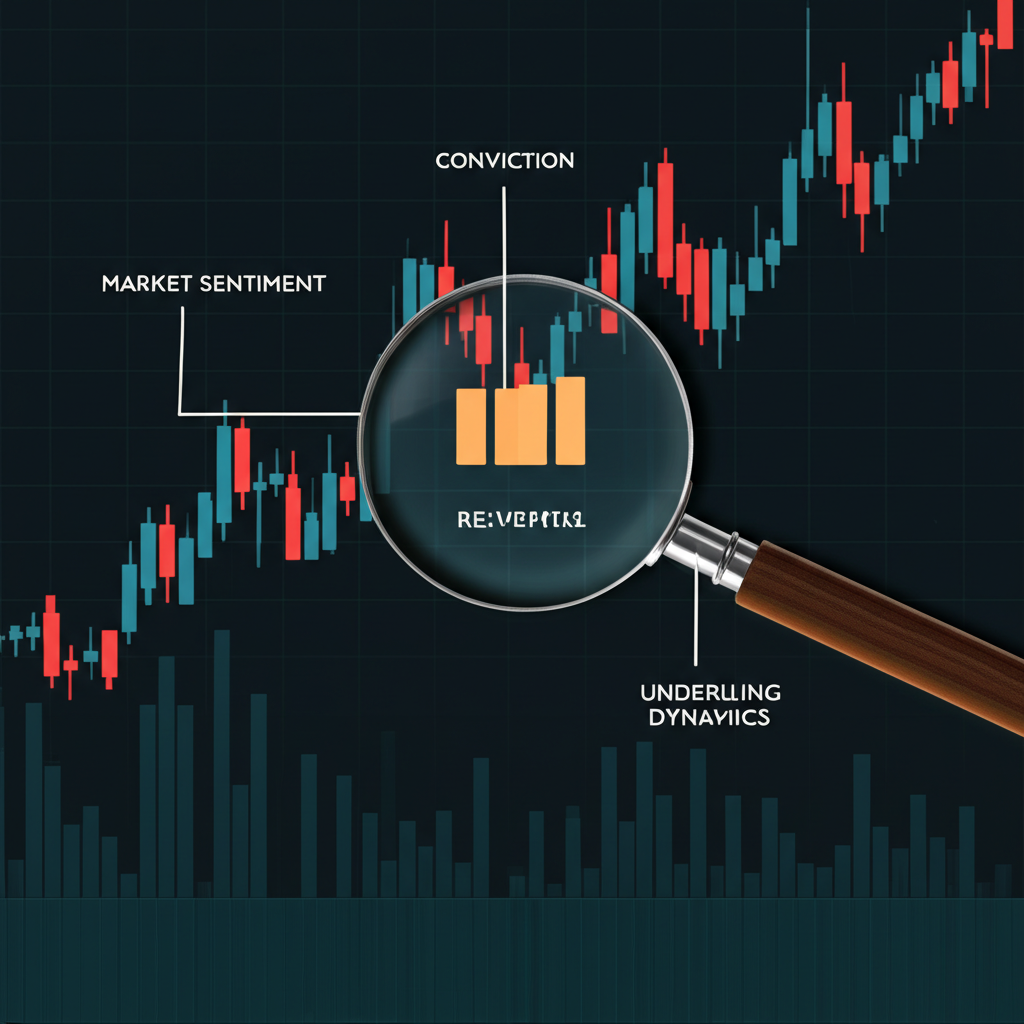
Unveiling Market Sentiment Through Volume
Volume acts as a real-time sentiment gauge. A sharp rally on high volume doesn’t just mean prices went up—it means a lot of people agreed on the direction. That kind of broad participation reflects strong conviction, often driven by institutional players or widespread retail enthusiasm. Conversely, a steep drop on heavy volume suggests panic, capitulation, or a coordinated sell-off. On the flip side, muted volume during price swings hints at apathy or uncertainty. For example, a stock creeping higher on low volume may be moving due to thin liquidity rather than real demand. These quiet moves are often reversed quickly once more participants enter the market. Recognizing the emotional tone behind volume allows traders to position themselves ahead of major shifts.
Interpreting Volume and Price Action: Classic Scenarios
The true power of volume emerges when it’s analyzed in tandem with price. Together, they form a dynamic duo that reveals the underlying mechanics of market moves. By understanding how volume responds to price changes, traders can spot high-probability setups and avoid traps.
Four Key Volume-Price Interpretations
These classic patterns form the backbone of volume-based analysis:
- Price Up, Volume Up: Strong Bullish Trend. This combination is the hallmark of a powerful rally. Rising prices supported by increasing volume indicate growing demand and broad participation. It’s the kind of move that often has room to run, especially if it follows a breakout from a consolidation zone.
- Price Down, Volume Up: Strong Bearish Trend. A steep decline on heavy volume reflects intense selling pressure. This is common during market corrections or when negative news triggers widespread exits. Such moves can be volatile but are often sustained due to the overwhelming supply.
- Price Up, Volume Down: Weak Rally, Potential Reversal. When prices climb but volume dries up, it’s a sign of lackluster interest. Fewer buyers are stepping in to push prices higher, which makes the move vulnerable. This scenario often precedes a pullback or a shift in trend direction.
- Price Down, Volume Down: Weak Downtrend, Potential Reversal. Falling prices on low volume suggest sellers are losing urgency. If no one is rushing to sell, the downtrend may be exhausting itself. This environment often sets the stage for consolidation or a reversal, especially if value-seeking buyers begin to step in.
Identifying Breakouts, Breakdowns, and Reversals
One of the most practical uses of volume is confirming breakouts and breakdowns. When price pushes through a key resistance level on a surge of volume, it signals strong demand and increases the odds that the breakout will hold. The same logic applies to breakdowns below support—high volume confirms the validity of the move. However, breakouts on low volume are treated with caution. They often fail because they lack the backing of broad market participation. Volume is equally useful in spotting reversals. A classic sign is volume divergence: when price makes a new high but volume is lower than during the previous peak. This suggests weakening momentum and can foreshadow a top. Similarly, a “selling climax”—a dramatic drop on extreme volume—often marks the end of a downtrend, as the last wave of panicked sellers exits the market, leaving buyers in control.
Advanced Volumetric Analysis: Beyond Basic Bar Charts
While standard volume bars offer valuable insights, advanced traders go deeper—examining not just how much volume occurred, but where and how it happened. These methods provide a structural view of the market, revealing hidden support and resistance levels and the behavior of large players.
Understanding Volume Profile: Price-Based Volume Analysis
Volume Profile shifts the focus from time-based volume to price-based volume. Instead of showing how much was traded each hour, it displays how much volume accumulated at specific price levels over a selected period. This creates a sideways histogram across the chart, highlighting zones of high and low activity.
- Value Area (VA): This is the price range where roughly 70% of the total volume was traded. It represents the consensus price zone—where most market participants were active.
- Point of Control (POC): The single price with the highest traded volume. It’s the most agreed-upon price and often acts as a magnet or pivot point.
- High/Low Volume Nodes: High Volume Nodes (HVNs) are areas of strong market activity and tend to act as support or resistance. Low Volume Nodes (LVNs) are gaps in activity where price often moves quickly, as there’s little “congestion” to slow it down.
Traders use Volume Profile to identify fair value, anticipate reversals, and plan entries and exits. One well-known concept is the “80% rule“: if the market opens outside the prior day’s Value Area but then moves back in and holds there for the first hour, there’s an 80% chance it will eventually trade through the entire Value Area. This pattern is especially useful for intraday traders in futures and equities.
An Introduction to Order Flow Trading
Order Flow takes volume analysis into the micro-level, examining the actual flow of buy and sell orders in real time. Unlike volume, which aggregates transactions, order flow shows the imbalance between aggressive buyers (hitting the ask) and aggressive sellers (hitting the bid). Traders use tools like footprints charts and delta indicators to see where large orders are being placed, whether institutions are accumulating or distributing, and when liquidity is being absorbed. A sudden spike in buy orders at a key support level, for example, can signal institutional buying. While complex and data-intensive, order flow gives short-term traders an edge by revealing the mechanics of price movement before it happens. The CME Group provides resources on order flow trading, particularly in the context of futures markets where transparency is higher.
Market-Specific Volume Differences: Stocks vs. Forex
Interpreting volume isn’t one-size-fits-all. The nature of the market determines the reliability and meaning of volume data.
- Stock Market (Actual Share Volume): Stock exchanges are centralized, meaning every trade is recorded. This allows for precise volume tracking—each share traded is counted. As a result, volume in equities is a reliable indicator of participation, conviction, and liquidity.
- Forex Market (Tick Volume): The foreign exchange market is decentralized, with no single clearinghouse. There’s no official way to track the total number of currency units traded globally. Instead, traders use tick volume—the number of times the price changes in a given period. While not a direct measure of transaction size, tick volume correlates with activity. A surge in ticks often means increased trading activity, even if the actual volume is unknown. However, tick volume must be interpreted carefully—it can be influenced by high-frequency trading and doesn’t reflect trade size.
Understanding this distinction is critical. What looks like a volume spike in Forex might not carry the same weight as one in stocks. Traders must adjust their expectations and strategies accordingly.
Popular Volume Trading Strategies and Indicators
Beyond visual analysis, several technical indicators incorporate volume to generate signals and confirm price action. These tools help quantify volume trends and make them easier to interpret.
On-Balance Volume (OBV): Measuring Buying/Selling Pressure
On-Balance Volume (OBV) is a cumulative indicator that adds volume on up days and subtracts it on down days. The idea is simple: when price rises on high volume, it signals strong buying pressure; when it falls on high volume, it shows strong selling. The OBV line tracks the net flow of volume over time.
- A rising OBV confirms an uptrend and suggests accumulation.
- A falling OBV confirms a downtrend and indicates distribution.
- Divergences are key: if price makes a new high but OBV does not, it’s a bearish divergence and may signal weakening momentum.
OBV is particularly useful for spotting early signs of trend exhaustion. For a deeper dive, Fidelity’s learning center offers insights into how OBV can be applied in real-world trading.
Volume Weighted Average Price (VWAP): Institutional Benchmark
VWAP calculates the average price of an asset weighted by volume at each point in time. It’s widely used by institutional traders to assess execution quality and determine fair value during the trading day.
- Price trading above VWAP suggests bullish bias.
- Price below VWAP indicates bearish sentiment.
- Institutions often aim to buy below VWAP and sell above it, making VWAP a dynamic support/resistance level.
Retail traders use VWAP to align with institutional flow. A pullback to VWAP on low volume in an uptrend, for example, can be a high-probability entry point.
Accumulation/Distribution Line: Tracking Money Flow
The Accumulation/Distribution (A/D) Line measures the flow of money into or out of a security by considering both volume and price range. It’s based on the idea that the close relative to the high-low range reflects buying or selling pressure.
- A rising A/D Line indicates accumulation—buyers are in control.
- A falling A/D Line signals distribution—sellers are dominating.
- Like OBV, divergences between the A/D Line and price can warn of reversals.
While similar to OBV, the A/D Line incorporates price range, making it more sensitive to intraday volatility.
Integrating Volume with Candlestick Patterns
Volume adds credibility to candlestick signals. A bullish engulfing pattern on high volume carries much more weight than the same pattern on low volume. The surge in volume confirms that buyers overwhelmed sellers decisively. Similarly, a doji—a sign of indecision—appearing after a strong trend on high volume can signal a turning point, as both sides are battling for control. Conversely, a hammer or shooting star pattern on low volume should be treated with skepticism, as it may simply reflect a lack of interest rather than a genuine reversal attempt.
Common Pitfalls and How to Avoid Them in Volume Trading
Despite its power, volume analysis is prone to misinterpretation. Avoiding these common mistakes can save traders from costly errors.
Misinterpreting Low Volume and Ignoring Context
Not all low volume is bearish. In some cases, low volume during a downtrend can indicate that sellers are exhausted, setting up a potential bounce. Similarly, low volume during a consolidation phase may reflect quiet accumulation by large players who don’t want to move the market prematurely. Context is everything. A holiday week with low volume isn’t the same as a mid-week lull in a trending market. Always consider the broader picture—price structure, news events, time of day, and market cycle—before drawing conclusions from volume alone.
Over-reliance on Single Indicators and Data Limitations
Volume should never be used in isolation. A spike in volume means little without knowing where it occurred—was it at a key resistance level? Was it part of a breakout? Always combine volume analysis with other tools: moving averages, RSI, MACD, Fibonacci levels, and chart patterns. In markets with limited data—like Forex tick volume or illiquid stocks—volume signals can be misleading. A single large trade can distort volume readings, creating false breakouts. Cross-verify volume signals with price action and multiple indicators to build a robust trading edge.
Conclusion: Harnessing the Full Potential of Volumen Trading
Volumen trading—more accurately understood as volume analysis—is a cornerstone of effective market analysis. It transforms price charts from flat, two-dimensional images into dynamic, three-dimensional maps of supply and demand. By revealing the strength behind price moves, confirming trends, and uncovering hidden market structure, volume empowers traders to make more informed decisions. From basic volume bars to advanced tools like Volume Profile and Order Flow, the insights gained from volume are invaluable. When combined with sound risk management and a disciplined approach, volume analysis becomes a powerful lens through which to view the market. The key is not just to watch volume—but to understand it, interpret it, and use it to stay ahead of the crowd.
Frequently Asked Questions About Trading Volume
What does “volumen trading” actually refer to in financial markets?
“Volumen trading” is a common alternative spelling or linguistic variation for “volume trading” or “volume of trade.” It refers to the analysis of the total quantity of a security or asset that has been exchanged between buyers and sellers over a specific period, typically displayed alongside price charts.
How is trading volume accurately calculated for different asset classes?
For centralized markets like stock exchanges, trading volume represents the actual number of shares or contracts traded, as every transaction is recorded. In decentralized markets like Forex, actual volume is unavailable, so “tick volume” is used as a proxy, counting the number of price changes (ticks) within a given timeframe.
What is the significance of trading volume in confirming market trends and reversals?
High volume typically confirms the strength and sustainability of a price trend, indicating broad market participation and conviction. Conversely, declining volume during a trend suggests weakening momentum and potential for a reversal. Divergences between price and volume often signal impending trend changes.
How does volume analysis differ when trading stocks compared to Forex?
In stock trading, you analyze actual volume, which is a precise count of shares traded. In Forex, you analyze tick volume, which is a proxy representing the number of price changes. While both indicate market activity, tick volume does not directly reflect the quantity of currency exchanged, making its interpretation slightly different.
Can you explain the “80% rule” in the context of Volume Profile analysis?
The “80% rule” in Volume Profile suggests that if the market opens outside the previous day’s Value Area (the price range where 70% of the volume was traded) but then quickly trades back into it and remains within the Value Area for a significant period (e.g., the first hour), there’s an 80% probability that price will trade through the entire previous day’s Value Area.
What are some common misconceptions or pitfalls to avoid when interpreting trading volume?
Common pitfalls include misinterpreting low volume (it doesn’t always mean weakness; it could be consolidation) and over-relying on volume in isolation without considering price action, chart patterns, or other indicators. It’s also crucial to understand the limitations of volume data, particularly in less liquid markets or for tick volume in Forex.
Which technical indicators are most effective when used in conjunction with trading volume?
Effective volume-based indicators include On-Balance Volume (OBV), Volume Weighted Average Price (VWAP), and the Accumulation/Distribution Line. These are best used alongside traditional price-based indicators like moving averages, Relative Strength Index (RSI), MACD, and candlestick patterns to provide confirmation and a more holistic market view.
How can traders use volume to identify potential breakouts from consolidation patterns?
A significant surge in trading volume when price breaks out of a consolidation pattern (e.g., a triangle, rectangle, or channel) provides strong confirmation that the breakout is genuine and has sufficient market conviction to continue. A breakout on low volume is often considered a false signal.
Does a sudden surge in trading volume always indicate a continuation of the current price trend?
Not always. While high volume often confirms a trend, a sudden, extreme surge in volume after a prolonged trend can sometimes indicate a “climax” event (buying climax or selling climax), suggesting exhaustion and potentially signaling a reversal rather than a continuation. Context is vital.
What are some effective strategies for integrating volume analysis into a trading plan?
Effective strategies include:
- Trend Confirmation: Use rising volume to validate current trends.
- Breakout Validation: Look for high volume on breakouts from support/resistance.
- Divergence Detection: Identify divergences between price and volume/volume indicators (like OBV) for potential reversals.
- Support/Resistance Identification: Utilize Volume Profile to pinpoint high volume nodes as strong levels.
- Institutional Activity: Use VWAP to gauge institutional participation and fair value.
發佈留言
很抱歉,必須登入網站才能發佈留言。