RSI Meaning: Decoding the Financial Indicator and Medical Condition
Introduction: What Does RSI Mean?
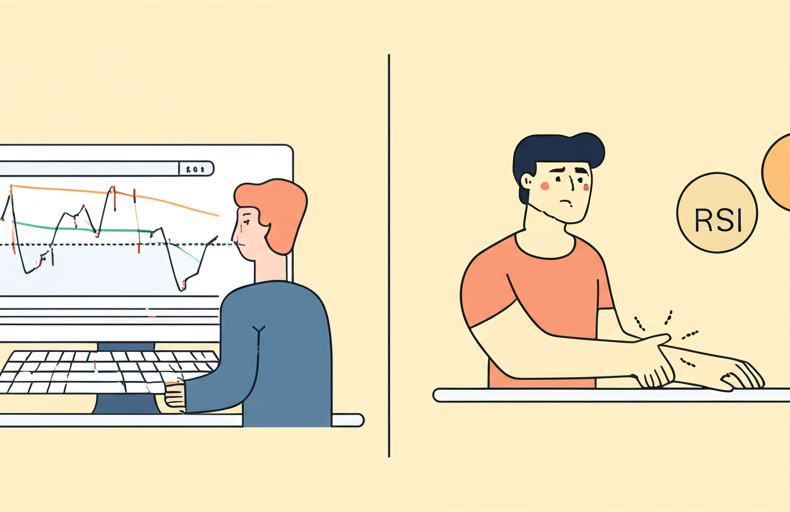
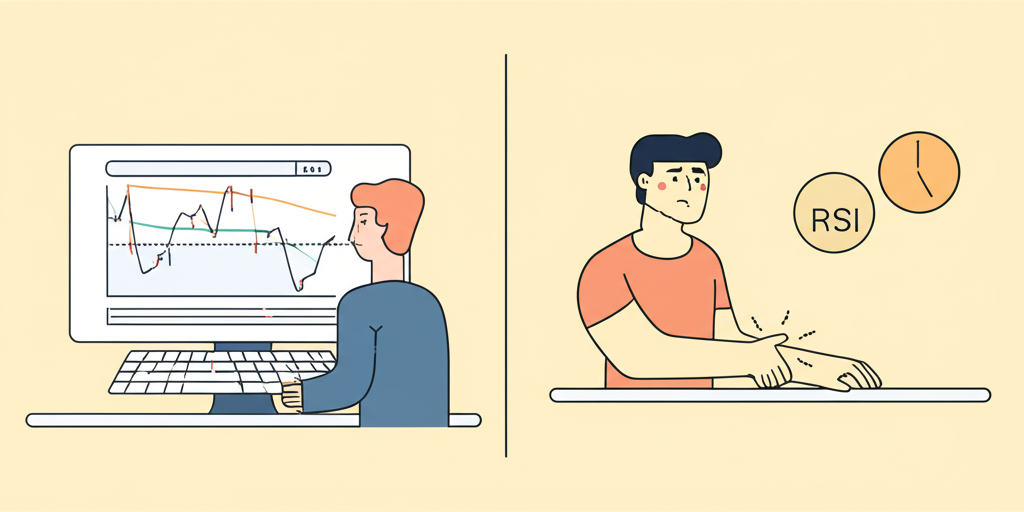
The term “RSI” appears frequently across different fields, from financial reports to medical journals, often leaving readers wondering about its true meaning. In most contexts, especially within investing and trading, RSI refers to the Relative Strength Index—a widely used technical analysis tool that helps gauge market momentum. However, outside of finance, the same acronym stands for Repetitive Strain Injury, a common condition linked to repetitive physical tasks. While both are significant in their respective domains, this article will focus primarily on the financial interpretation of RSI, offering a thorough breakdown of how it works, how to read it, and how traders apply it in real-world scenarios. To avoid confusion, we’ll also briefly clarify its other meanings, ensuring you understand exactly what RSI signifies depending on the context.
The Relative Strength Index (RSI): A Core Technical Indicator
In the fast-moving world of financial markets, timing is everything. One of the most effective ways traders assess whether a trend is losing steam or gaining strength is through the Relative Strength Index. This momentum-based oscillator has become a staple in technical analysis, offering insights into not just where prices have been, but where they might be headed based on underlying buying and selling pressure.
What is the Relative Strength Index?
Developed by J. Welles Wilder Jr. and introduced in his 1978 book *New Concepts in Technical Trading Systems*, the Relative Strength Index measures the magnitude of recent price changes to evaluate overvalued or undervalued conditions in a market. It operates on a scale from 0 to 100, making it easy to interpret at a glance. When the RSI climbs toward the upper end of the scale, it suggests strong upward momentum; when it dips lower, it reflects increasing downward pressure.
Unlike simple price charts, RSI reveals the velocity behind price movements—essentially showing how fast buyers or sellers are driving the market. This makes it particularly useful for identifying potential turning points before they appear clearly on price charts. Traders use RSI across a wide range of assets, including stocks, forex pairs, commodities, and cryptocurrencies, which speaks to its adaptability and reliability when applied correctly.
How is RSI Calculated? Understanding the Formula
Modern trading platforms compute RSI automatically, but understanding the math behind it adds depth to your analysis. The calculation involves two main steps.
First, you determine the Relative Strength (RS), which is the average of upward price changes divided by the average of downward price changes over a set number of periods—typically 14. For example, if a stock closes higher on eight days out of the past 14, those gains are averaged. On the days it closed lower, the losses (converted to positive values) are averaged separately.
Then, the RS value is plugged into the core RSI formula:
RSI = 100 – [100 / (1 + RS)]
The initial 14-period average uses a simple calculation. After that, Wilder applied a smoothing technique, similar to an exponential moving average, so more recent data has greater influence. This adjustment helps the indicator stay responsive without becoming too erratic.
Although 14 periods is standard, traders may adjust this depending on their strategy—shorter periods make RSI more sensitive, while longer ones smooth out volatility. For those interested in deeper mechanics, Investopedia offers a detailed explanation of the Relative Strength Index.
Interpreting RSI: Overbought, Oversold, and Divergence
One of the key strengths of RSI lies in its ability to highlight shifts in market sentiment. By analyzing specific levels and patterns, traders can spot early clues about potential reversals or continuation moves.
Overbought and Oversold Conditions
The most basic way to interpret RSI is through its overbought and oversold thresholds. A reading above 70 is generally considered overbought, indicating that an asset may have risen too quickly and could be due for a pullback. Conversely, a reading below 30 suggests the asset is oversold, potentially setting up for a rebound.
However, these levels aren’t foolproof. In strong trending markets, RSI can remain above 70 during extended rallies or below 30 during sharp sell-offs. For instance, a breakout stock in a powerful uptrend might maintain an RSI above 70 for weeks without reversing. That’s why experienced traders don’t treat these levels as automatic buy or sell signals—they use them as warning signs that momentum may be stretching thin.
To adapt to different market environments, some traders tweak the thresholds. In highly volatile assets like cryptocurrencies, using 80 and 20 instead of 70 and 30 can help filter out noise and identify more extreme conditions.
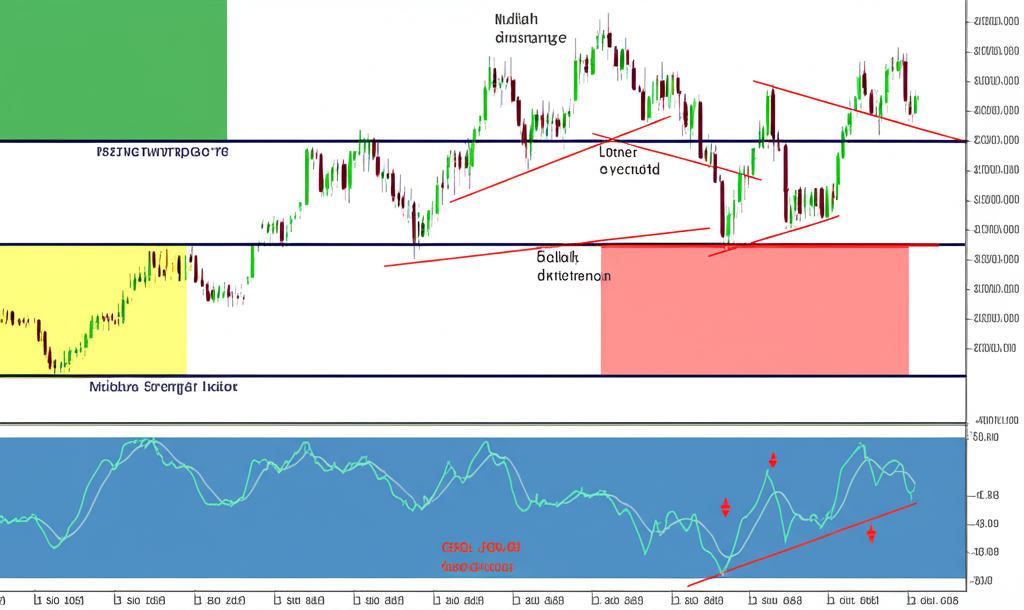
Understanding RSI Divergence
Divergence occurs when the direction of price movement contradicts the movement of the RSI line. This mismatch often signals weakening momentum and can precede a trend reversal.
Bullish divergence happens when price makes a new low, but RSI forms a higher low. This suggests that despite lower prices, downward momentum is slowing—buyers may be stepping in. For example, a stock drops to $45, then falls further to $42, but its RSI doesn’t follow suit and instead rises slightly at the second low. That disconnect could foreshadow a bounce.
Bearish divergence appears when price hits a higher high, yet RSI reaches a lower high. This means the rally is losing strength. Imagine a cryptocurrency climbing from $30,000 to $35,000, but the RSI fails to surpass its previous peak. That divergence might warn of an impending drop.
While powerful, divergence signals should never be acted upon alone. They work best when confirmed by price action or other indicators like volume or moving averages.
RSI Centerline Crossovers (50-level)
The 50 level acts as a neutral midpoint on the RSI scale. Crossing above or below this line can signal a shift in momentum.
When RSI moves above 50, it indicates that upward momentum is gaining ground—buyers are outpacing sellers. A sustained move above this level often aligns with bullish trends. On the flip side, a drop below 50 suggests bearish control, where selling pressure dominates.
Traders sometimes use the 50 crossover as a trend confirmation tool. For example, if an asset emerges from oversold territory and RSI climbs above 50, it may confirm that the downtrend has lost steam and a new uptrend is forming. While not a standalone entry signal, the 50 level adds valuable context to other RSI readings.
How to Use RSI in Your Trading Strategy
To get the most out of RSI, it should be part of a broader trading framework rather than used in isolation. Successful traders combine RSI signals with other tools and market context to improve accuracy and reduce false signals.
Generating Buy and Sell Signals with RSI
One of the most common uses of RSI is to generate entry and exit points.
A potential buy signal occurs when RSI rises from below 30 back above that level. This suggests that oversold conditions are easing and buyers are returning. Even stronger signals emerge when this happens alongside bullish candlestick patterns—like a hammer or bullish engulfing—or when price is near a known support zone.
Conversely, a sell signal is triggered when RSI drops from above 70 to below it, indicating that overbought conditions are resolving and selling pressure is increasing. This becomes more reliable when accompanied by bearish patterns like shooting stars or evening dojis, especially near resistance levels.
It’s important to remember that RSI doesn’t guarantee a reversal—it only highlights the possibility. Acting too early, especially in strong trends, can lead to losses. Patience and confirmation are essential.
Combining RSI with Other Technical Indicators
RSI gains strength when paired with complementary tools. Here are some effective combinations:
- Moving Averages: If RSI exits oversold territory while price remains above a key moving average (such as the 50-day or 200-day MA), the bullish signal carries more weight. Similarly, a bearish RSI crossover below 70 gains credibility if price is below a major moving average.
- MACD: Using RSI alongside the Moving Average Convergence Divergence (MACD) can provide dual confirmation of momentum shifts. When both indicators show bullish divergence, the likelihood of a reversal increases.
- Support and Resistance: An oversold RSI near a historical support level is far more meaningful than one occurring in open territory. The confluence of technical factors increases the probability of a bounce.
- Candlestick Patterns: A bullish reversal candle forming at the same time RSI moves above 30 can serve as a strong visual confirmation of renewed buying interest.
Layering multiple forms of analysis helps filter out noise and improves decision-making.
RSI Strategies Across Different Markets
RSI’s flexibility allows it to be adapted across various financial markets, each with its own rhythm and volatility profile.
- Stocks: In equities, RSI is especially effective for swing traders and investors looking to time entries and exits. For large-cap stocks with stable trends, an RSI above 70 often precedes a temporary pullback, offering buying opportunities on weakness. For example, if Apple’s stock hits an RSI of 76 with bearish divergence, it might signal a short-term top.
- Forex: Currency pairs often move in extended trends, so RSI is best used to identify exhaustion points rather than immediate reversals. On daily or 4-hour charts, divergence can provide early warnings. If USD/JPY makes a new high but RSI fails to confirm, it could suggest weakening momentum and a pending correction.
- Cryptocurrencies: Given their extreme volatility, crypto traders often rely on RSI to catch rapid reversals. Many adjust the standard thresholds to 80/20 to avoid whipsaws. For instance, if Bitcoin’s RSI plunges below 20 during a flash crash, it might indicate panic selling and a potential bounce. Conversely, an RSI spike above 80 after a parabolic rise often precedes a sharp pullback.
Adapting RSI settings and interpretation to each market enhances its effectiveness.
Limitations and Common Pitfalls of RSI
Despite its popularity, RSI is not a crystal ball. Understanding its weaknesses is just as important as knowing how to use it.
One major issue is false signals. In strong trending markets, RSI can stay overbought or oversold for long stretches. Acting on a sell signal because RSI is above 70 in a powerful bull market could mean missing out on significant gains. The same applies in downtrends—selling short because RSI is below 30 might lead to losses if the decline continues.
Another common mistake is using RSI alone. No single indicator captures the full picture. Relying solely on RSI without considering volume, trendlines, or fundamental factors increases the risk of poor decisions.
Additionally, RSI provides no insight into the size or duration of a potential reversal. An oversold reading doesn’t guarantee a big bounce—it might only lead to a minor correction before the downtrend resumes. Traders must manage position size and risk accordingly.
Finally, incorrect settings can distort results. While 14 periods is standard, it may not suit every asset or timeframe. A shorter period like 7 makes RSI more reactive but prone to noise, while a longer one like 21 smooths it out but may lag behind price action. Testing different settings through backtesting can help find the optimal configuration for your strategy.
For those aiming to build a resilient trading plan, solid risk management practices are essential to mitigate these limitations.
Beyond Finance: Other Meanings of RSI
While the financial world associates RSI with market momentum, the acronym holds entirely different significance in other areas—most notably in healthcare.
RSI as Repetitive Strain Injury (Medical)
In medical terms, RSI stands for Repetitive Strain Injury, a condition caused by repeated physical movements that damage tendons, nerves, and muscles. It commonly affects people who perform repetitive tasks—such as typing, using a mouse, or assembly line work.
Symptoms include pain, stiffness, tingling, numbness, and weakness, typically in the hands, wrists, forearms, or shoulders. The discomfort often worsens with activity and improves with rest. Left untreated, RSI can become chronic and debilitating.
Treatment usually involves rest, physical therapy, ergonomic adjustments (like improved chair height or keyboard placement), pain relievers, and in severe cases, corticosteroid injections. Early intervention is key to preventing long-term damage.
It’s crucial to distinguish this medical condition from the financial indicator, as they exist in completely different realms and serve entirely different purposes.
Other Niche Meanings of RSI
Outside finance and medicine, RSI occasionally appears in specialized fields:
- Technology: May refer to “Radio Signal Interference” or “Remote Sensing Information,” depending on the context.
- Automotive: Sometimes stands for “Rotational Speed Indicator” or appears in proprietary system names.
- AI and Robotics: Rarely used as an acronym in academic research, though no standardized meaning exists.
These uses are limited to specific industries and lack the widespread recognition of the financial or medical definitions. Context is always the best guide for determining which RSI is being referenced.
Conclusion: Leveraging RSI for Informed Decisions
The Relative Strength Index remains one of the most trusted tools in a trader’s toolkit. Since its introduction by J. Welles Wilder Jr., it has helped countless investors understand market momentum, identify potential reversals, and refine their timing. By mastering its core components—overbought/oversold levels, divergence, and centerline crossovers—traders can gain a clearer view of market dynamics.
Yet, its real power emerges when combined with other analytical methods. Using RSI in isolation increases the risk of misleading signals. Integrating it with price action, volume, moving averages, or support/resistance levels enhances its reliability. Awareness of its limitations—such as false signals in strong trends or the inability to predict reversal magnitude—is critical for sound risk management.
While “RSI” may also refer to Repetitive Strain Injury in medical discussions, its dominant role in financial analysis makes it indispensable for traders across stocks, forex, and crypto markets. By applying RSI thoughtfully and contextually, investors can make more informed, strategic decisions in pursuit of their financial objectives.
Frequently Asked Questions (FAQs)
What does an RSI tell you in trading?
In trading, the Relative Strength Index (RSI) is a momentum oscillator that measures the speed and change of price movements. It tells you whether a security’s price has risen or fallen too quickly, indicating potential overbought or oversold conditions, and providing insights into the strength of a trend and possible reversals. It oscillates between 0 and 100.
What is a good RSI for a stock?
There isn’t a single “good” RSI value, as its interpretation depends on the context. Generally:
- An RSI above 70 indicates an overbought condition, suggesting the stock might be due for a pullback.
- An RSI below 30 indicates an oversold condition, suggesting the stock might be due for a bounce.
- An RSI between 30 and 70 indicates a neutral range, with values above 50 showing bullish momentum and below 50 showing bearish momentum.
The “goodness” is in recognizing these conditions relative to the stock’s trend and other indicators.
How do you interpret RSI signals?
RSI signals are interpreted primarily through:
- Overbought/Oversold Levels: Above 70 (overbought) suggests a potential sell signal or pullback, while below 30 (oversold) suggests a potential buy signal or bounce.
- Divergence: When price and RSI move in opposite directions (e.g., price makes a lower low, but RSI makes a higher low), it signals a potential trend reversal.
- Centerline Crossovers (50-level): A move above 50 confirms bullish momentum, while a move below 50 confirms bearish momentum.
Always seek confirmation from other indicators or price action.
Can RSI be used for cryptocurrency trading?
Yes, RSI is widely used and highly effective in cryptocurrency trading. Given the high volatility of crypto markets, RSI can be particularly useful for identifying extreme overbought or oversold conditions and rapid reversals. Some crypto traders even adjust the standard 70/30 thresholds to 80/20 to account for the larger price swings common in digital assets.
What is the difference between RSI meaning in trading and RSI meaning medical?
The difference is significant:
- In Trading: RSI stands for Relative Strength Index, a technical analysis indicator measuring momentum in financial markets.
- In Medical: RSI stands for Repetitive Strain Injury, a physical condition characterized by pain in muscles, nerves, and tendons due to repetitive movements or overuse.
They are entirely unrelated concepts that share the same acronym.
How to use the RSI indicator for buy and sell signals?
To generate buy and sell signals with RSI:
- Buy Signal: Look for RSI to move out of oversold territory (crossing above 30) or for bullish divergence (price makes lower lows, RSI makes higher lows).
- Sell Signal: Look for RSI to move out of overbought territory (crossing below 70) or for bearish divergence (price makes higher highs, RSI makes lower highs).
Always combine these signals with other forms of analysis for confirmation to reduce false positives.
What are the limitations of the Relative Strength Index?
Key limitations of RSI include:
- False Signals: RSI can remain overbought or oversold for extended periods during strong trends, leading to premature entry/exit.
- Lack of Magnitude: It doesn’t predict how much a price will reverse, only the potential for reversal.
- Not a Standalone Indicator: It should not be used in isolation but always in conjunction with other technical tools.
- Dependence on Settings: Incorrect lookback periods can generate too much noise or too few relevant signals.
Does RSI meaning car or RSI meaning AI relate to financial RSI?
No, “RSI” in the context of cars (e.g., Rotational Speed Indicator) or AI (which might be a specific project acronym) does not relate to the financial Relative Strength Index. These are separate, niche uses of the acronym within specific industries or fields. The financial RSI is exclusively a technical analysis tool for market momentum.
發佈留言
很抱歉,必須登入網站才能發佈留言。