
Fibonacci Channel: The Ultimate Guide to Dynamic Support, Resistance, and Trend Prediction
Introduction to Fibonacci Channels

In the fast-moving world of financial markets, traders rely heavily on tools that reveal hidden patterns in price behavior. Among these, technical analysis stands as a foundational method for interpreting market psychology and forecasting future movements. One of the most intriguing and mathematically grounded approaches involves Fibonacci-based tools—particularly Fibonacci Channels. These aren’t just arbitrary lines on a chart; they’re derived from a sequence found throughout nature, art, and even human perception. When applied correctly, Fibonacci Channels offer a dynamic lens through which traders can assess trend strength, identify high-probability support and resistance zones, and anticipate potential reversal points. This guide explores how to construct, interpret, and trade using Fibonacci Channels across various market conditions, with practical insights for both novice and experienced traders.
What Are Fibonacci Channels? Understanding the Core Concept
At the heart of Fibonacci Channels lies the famous Fibonacci sequence—a series where each number is the sum of the two preceding ones: 0, 1, 1, 2, 3, 5, 8, 13, 21, and so on. As this sequence progresses, the ratio between consecutive numbers converges toward 1.618, known as the golden ratio. Its inverse, 0.618, along with other related ratios like 0.382, 1.000, and 2.618, frequently appear in natural structures—from spiral galaxies to seashells—and have been observed to influence financial market movements as well.
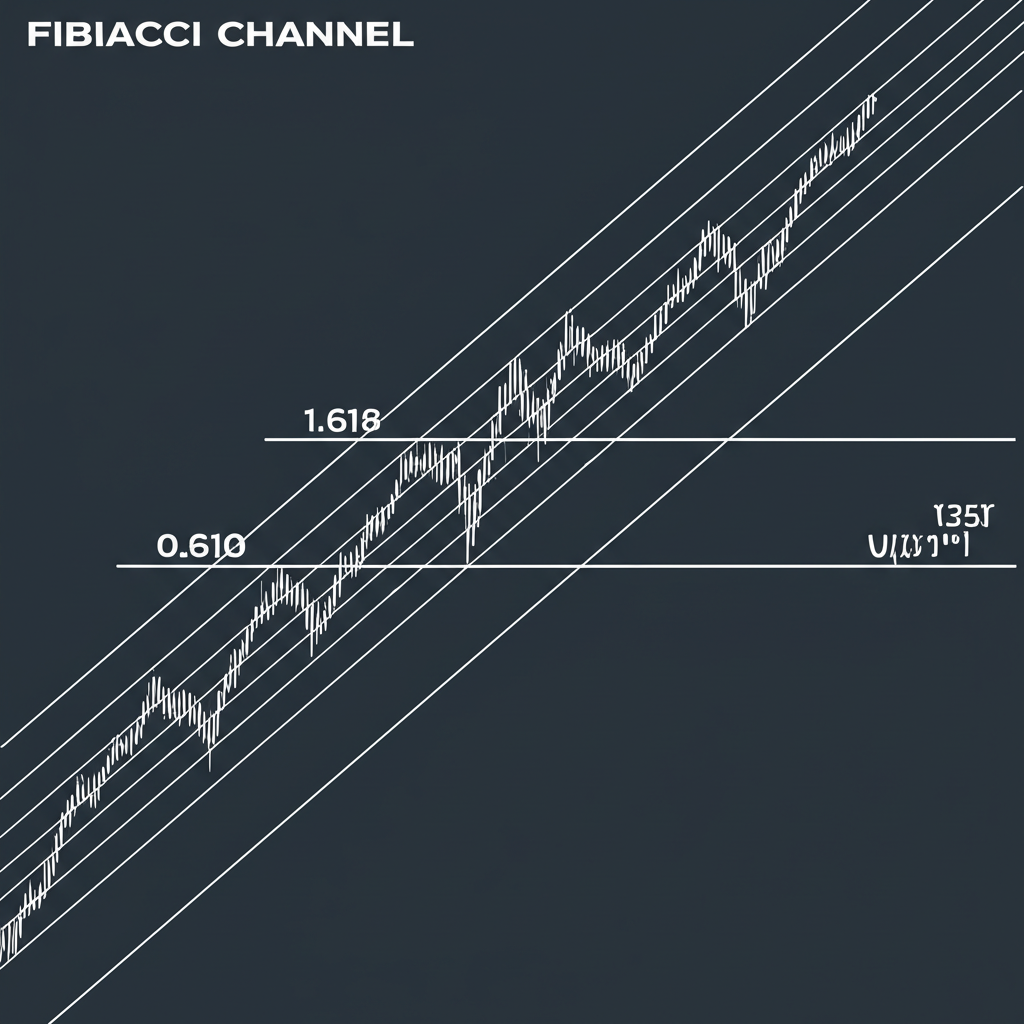
A Fibonacci Channel takes these ratios beyond static retracement levels by creating an angled, parallel corridor that evolves with price action. Unlike Fibonacci Retracements, which project horizontal levels after a single price swing, channels track ongoing trends dynamically. The tool uses three key points: two to establish the base trend line (such as a swing low to a swing high), and a third to define the initial channel width. From there, parallel lines are drawn at Fibonacci multiples (e.g., 0.618, 1.000, 1.618), forming zones that act as evolving support and resistance levels.
These lines don’t just mark where price *might* react—they reflect momentum and trend integrity. For example, if price consistently respects the lower boundary of an uptrend channel, it suggests strong underlying demand. Conversely, repeated rejections at upper extensions may signal overbought conditions or weakening bullish momentum. Because the channel moves with the trend, it adapts to changing market dynamics in real time, making it a powerful companion for trend-following strategies. To dive deeper into the mathematical underpinnings, Investopedia’s explanation of Fibonacci Channels provides a solid foundation.
How to Accurately Draw Fibonacci Channels
Drawing a reliable Fibonacci Channel hinges on precision in selecting anchor points. A poorly drawn channel can mislead rather than inform, turning a powerful tool into a source of false signals. The process requires careful observation and an understanding of market structure.
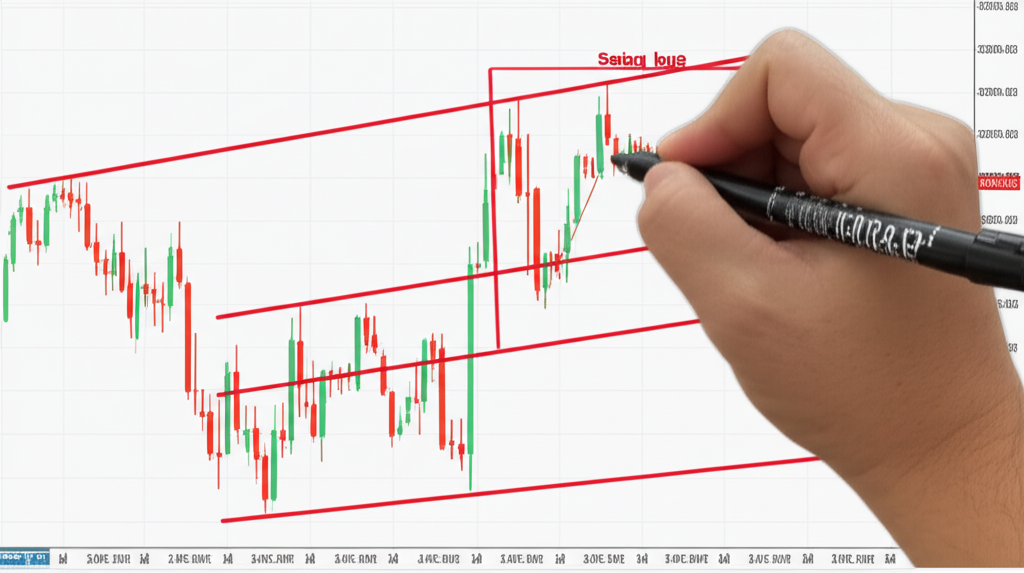
Identifying Key Price Swings for Channel Anchors
The accuracy of any Fibonacci Channel starts with identifying meaningful swing points—distinct highs and lows that mark shifts in market sentiment. These are not minor fluctuations but clear turning points where price reversed direction decisively.
For an **uptrend**, the ideal setup involves:
– **Point 1**: A significant swing low, marking the start of a new bullish phase.
– **Point 2**: The first major swing high following Point 1, establishing the initial momentum.
– **Point 3**: A subsequent higher swing low—the pullback that sets up the next leg up. This point determines the channel’s width and must align with the trend’s rhythm.
In a **downtrend**, the logic reverses:
– **Point 1**: A clear swing high.
– **Point 2**: The following swing low.
– **Point 3**: A lower swing high during the corrective bounce, used to set the channel width.
Choosing weak or irrelevant pivots—like small intraday wicks or noise within a consolidation—can distort the entire structure. A useful trick is to zoom out and view the chart on a higher timeframe first. This broader perspective helps filter out market noise and reveals the dominant trend’s true trajectory. If the channel fails to contain price over subsequent candles, reconsider your anchor selection.
Step-by-Step Guide on Popular Platforms (TradingView & MT5)
Most modern trading platforms include built-in Fibonacci Channel tools, streamlining the drawing process.
**On TradingView:**
1. Locate the **”Gann and Fibonacci Tools”** section in the left toolbar (usually represented by a Fibonacci icon).
2. Select **”Fibonacci Channel”** from the dropdown menu.
3. Click on **Point 1**—the initial swing low (for an uptrend) or swing high (for a downtrend).
4. Drag to **Point 2**—the next significant swing in the opposite direction—and click. This creates the base trend line.
5. Move to **Point 3**—the parallel swing point (e.g., a higher low in an uptrend)—and click to finalize the channel width.
6. The full set of parallel lines will automatically generate at Fibonacci ratios, extending forward.
**On MetaTrader 5 (MT5):**
1. Go to **Insert > Objects > Fibonacci > Fibonacci Channel**.
2. Click **Point 1** on the chart.
3. Drag to **Point 2** and release to set the angle.
4. Adjust the third point manually by dragging it parallel to the base line, aligning it with a confirmed swing point to establish the channel width.
5. Confirm by releasing the mouse button.
Once drawn, the channel becomes a living element of your chart, adapting as new price data arrives—especially if you enable extension settings. For visual learners, TradingView’s guide on their Fibonacci Channel tool offers helpful screenshots and step-by-step visuals.
Customizing Channel Settings and Extension
After placing the channel, customization enhances readability and analytical value. Most platforms allow granular control via a right-click or double-click on the channel.
– **Style Tab**: Adjust line colors, thickness, and styles (solid, dashed, dotted) for each Fibonacci level. You might highlight the 1.618 extension in red to signal a strong resistance zone, while keeping the base channel in green for clarity.
– **Visibility Settings**: Control whether the channel appears across all timeframes or only on specific ones (e.g., visible only on the 4-hour chart).
– **Coordinate Adjustment**: Fine-tune anchor points numerically using exact price and time values, useful for backtesting or aligning with historical data.
– **Line Extension**: Ensure the **”Extend Lines”** option is enabled. Without it, the channel ends at the current bar, limiting its use for forward-looking analysis.
Customization isn’t just cosmetic—it supports mental clarity. A clean, well-organized chart reduces cognitive load and improves decision-making speed during live trading.
Interpreting Fibonacci Channels for Market Analysis
Once properly constructed, a Fibonacci Channel becomes a roadmap for trend analysis. It doesn’t predict price with certainty, but it outlines high-probability zones where market behavior is likely to shift.
Identifying Dynamic Support and Resistance Levels
The parallel lines within the channel function as moving barriers—support in uptrends, resistance in downtrends. Unlike fixed horizontal levels, these lines evolve with the trend, offering more relevant guidance in trending environments.
– In an **uptrend**, the lower boundary (base line) and the 0.618 retracement level often act as support zones. When price pulls back to these areas and bounces, it confirms buyer interest.
– The upper lines—especially 1.000, 1.618, and 2.618—serve as potential resistance levels. If price approaches these zones and shows hesitation (e.g., long upper wicks or bearish engulfing patterns), it may indicate exhaustion.
– Intermediate levels like 0.618 or 1.000 can also act as temporary pause points, where price consolidates before resuming the trend.
Watch how price interacts with each line: a clean bounce suggests trend strength, while a slow grind through a level may signal weakening momentum. A rejection at an extension level often precedes a corrective pullback.
Assessing Trend Direction and Strength
The channel’s slope itself conveys critical information about market dynamics.
– An **upward-sloping channel** indicates a bullish trend, while a **downward slope** reflects bearish momentum.
– A **steep angle** suggests strong momentum and aggressive participation—common in breakout phases or news-driven moves.
– A **shallow or flattening channel** may indicate waning momentum or accumulation before a potential reversal.
Additionally, the consistency with which price remains within the channel speaks to trend reliability. If price repeatedly touches but does not breach the boundaries, the trend is intact. Frequent violations, especially on high volume, may foreshadow a trend change.
Predicting Potential Price Reversals and Breakouts
Fibonacci Channels shine when anticipating turning points.
– **Reversal Signals**: When price reaches an extended level (like 1.618 or 2.618) after a prolonged move, watch for signs of rejection—such as pin bars, doji candles, or bearish engulfing patterns. These, combined with overbought RSI readings, increase the odds of a pullback.
– **Breakouts**: A decisive move beyond the channel’s boundary can signal acceleration or reversal.
– A breakout **above** an uptrend channel might reflect strong bullish momentum, possibly leading to a parabolic move.
– A break **below** the lower support line could indicate trend failure, especially if accompanied by rising volume.
– In a downtrend, a break **above** the upper resistance may signal a reversal to the upside.
Always wait for confirmation. A single candle closing outside the channel isn’t enough—a follow-through candle or volume spike adds credibility. False breakouts are common, particularly in volatile markets.
Effective Trading Strategies Using Fibonacci Channels
Fibonacci Channels aren’t just for observation—they form the backbone of actionable trading strategies.
Trend-Following Strategies within Channels
The most reliable use of Fibonacci Channels is in trend continuation setups.
– **Entry**: In an uptrend, look to buy when price pulls back to the lower channel line (e.g., base or 0.618 level) and shows bullish reversal signs—like a hammer candle or bullish engulfing pattern. Confirm with rising volume or a positive MACD crossover.
– **Exit/Target**: Use upper channel lines as profit targets. For instance, take partial profits at the 1.000 level and let the remainder run toward 1.618. Alternatively, trail your stop to lock in gains as price ascends.
– **Stop-Loss**: Place stops just below the support line in an uptrend (or above resistance in a downtrend). This keeps risk tight while allowing room for normal volatility.
This approach works best in strong, persistent trends—such as those seen in breakout phases or during strong fundamental catalysts.
Breakout and Reversal Strategies
Channels also help spot potential trend changes.
– **Breakout Entries**: A clean break above the upper channel line on strong volume could signal a surge in buying pressure. Enter long on the retest of the broken resistance (now support) for better risk-reward.
– **Reversal Entries**: If price reaches the 1.618 extension in an exhausted uptrend and forms a bearish pattern (e.g., shooting star), consider a short entry with a stop above the recent high.
These strategies carry higher risk and require stronger confirmation than trend-following trades.
Combining Channels with Other Indicators for Confluence
No single indicator works perfectly in isolation. The real power of Fibonacci Channels emerges when combined with complementary tools.
– **RSI (Relative Strength Index)**: Look for overbought (above 70) or oversold (below 30) readings at channel boundaries. A divergence—where price makes new highs but RSI fails to confirm—can signal an impending reversal.
– **MACD**: A bearish crossover near the upper channel line strengthens a potential pullback signal. A bullish crossover at the lower boundary supports a bounce.
– **Volume**: Rising volume on a breakout increases its validity. Low-volume breaks often fail.
– **Candlestick Patterns**: Pin bars, engulfing patterns, and inside bars at key levels add precision to entries and exits.
– **Moving Averages**: A confluence of the 50-period or 200-period MA with a Fibonacci level (e.g., 0.618) creates a high-probability reaction zone.
This multi-layered approach—known as confluence—dramatically improves signal reliability. As Babypips highlights, stacking multiple confirmations filters out noise and increases the win rate of trades.
Fibonacci Channels vs. Fibonacci Retracements: A Clear Comparison
Though both tools stem from the Fibonacci sequence, their applications differ significantly.
| Feature | Fibonacci Channels | Fibonacci Retracements |
| :————— | :—————————————————– | :—————————————————– |
| **Purpose** | Maps dynamic trend corridors and extension targets | Measures pullbacks within a trend |
| **Construction** | Requires three anchor points | Needs only two points (swing high and low) |
| **Application** | Best in trending markets | Ideal for counter-trend entries |
| **Output** | Angled, parallel lines that move with price | Static horizontal lines across a price range |
| **Information** | Shows trend strength, direction, and extension zones | Identifies potential reversal levels during corrections |
| **Dynamic Nature** | Adapts continuously to new price data | Fixed once drawn |
**When to Use Each:**
– Use **Fibonacci Channels** to stay aligned with a strong trend, identify entry points on pullbacks, and project future price extensions.
– Use **Fibonacci Retracements** to find optimal “buy the dip” levels in an uptrend or “sell the rally” zones in a downtrend.
Many traders use them together—for example, applying a retracement to a pullback within a larger channel-defined trend. When both tools align (e.g., a 0.618 retracement coincides with the channel’s lower boundary), the setup gains significant weight.
Common Mistakes When Using Fibonacci Channels (and How to Avoid Them)
Even experienced traders fall into traps when using Fibonacci Channels. Recognizing these pitfalls can save you from costly errors.
Incorrect Anchor Point Selection
Choosing weak or arbitrary swing points distorts the entire analysis. A channel built on minor wicks or noise will fail to reflect real market structure.
**Avoidance Tips:**
– Zoom out to higher timeframes to identify major turning points.
– Only use clear, well-defined pivots where price reversed decisively.
– Test your channel against historical price action—does it contain past moves?
Over-Reliance Without Confluence
Treating Fibonacci Channels as infallible predictors leads to overtrading. Markets don’t obey lines perfectly.
**Avoidance Tips:**
– Always seek confirmation from volume, momentum indicators, or candlestick patterns.
– Treat channels as a guide, not a rulebook.
– Use proper risk management—never risk more than 1-2% per trade.
Ignoring Market Context and Volatility
Channels lose effectiveness in sideways or choppy markets. Applying them in ranging conditions generates frequent false signals.
**Avoidance Tips:**
– Confirm the presence of a trend before drawing a channel. Look for higher highs and higher lows (uptrend) or lower highs and lower lows (downtrend).
– In volatile markets, widen your stops or switch to higher timeframes to reduce noise.
– Be aware of macroeconomic events—earnings reports, central bank decisions, or geopolitical shocks can invalidate technical patterns overnight.
By addressing these common issues, you transform Fibonacci Channels from a decorative chart tool into a strategic advantage.
Conclusion: Harnessing the Power of Fibonacci Channels
Fibonacci Channels are more than just a technical overlay—they are a dynamic framework for understanding market rhythm. Rooted in mathematical principles observed throughout nature, they offer traders a structured way to visualize trend evolution, momentum shifts, and potential turning points. From accurate anchor point selection to strategic interpretation and integration with other indicators, mastering this tool requires both discipline and contextual awareness.
When used correctly, Fibonacci Channels enhance trend identification, improve trade timing, and provide logical levels for entries, exits, and risk management. Their real strength emerges not in isolation but through confluence—when multiple signals align to tell a cohesive market story. Whether you’re trend-following, hunting breakouts, or anticipating reversals, this tool adds depth to your analysis.
Remember: no indicator guarantees success. Fibonacci Channels are a guide, not a crystal ball. But with practice, patience, and a commitment to sound methodology, they become a vital component of a robust trading strategy—helping you navigate the financial markets with greater clarity and confidence.
Frequently Asked Questions (FAQ)
1. What is the primary difference between a Fibonacci Channel and a Fibonacci Retracement?
The primary difference lies in their application and output. A Fibonacci Retracement helps identify potential support/resistance levels during a pullback or correction of a single price move, appearing as static horizontal lines. A Fibonacci Channel, however, creates dynamic, angled parallel lines that track an ongoing trend, indicating continuous support/resistance and potential price extensions within that trend. Channels require three anchor points to define a dynamic corridor, while retracements use two points to measure a specific price swing.
2. How do I identify the correct swing points to draw a Fibonacci Channel effectively?
Identifying correct swing points is crucial. For an uptrend, select a significant swing low (Point 1), followed by the subsequent swing high (Point 2), and then a higher swing low (Point 3) that initiated the next impulse move. For a downtrend, use a significant swing high (Point 1), the subsequent swing low (Point 2), and then a lower swing high (Point 3). Always zoom out to identify the most prominent and impactful pivots, avoiding minor fluctuations that might lead to an inaccurate channel.
3. Are Fibonacci Channels effective in all market conditions, or are they best suited for trending markets?
Fibonacci Channels are most effective in clearly trending markets (uptrends or downtrends). They are designed to track price movement within a consistent direction. In choppy, ranging, or highly volatile sideways markets, their reliability significantly decreases as price action lacks a clear directional bias and often moves erratically, making the channel boundaries less effective as predictive support/resistance levels.
4. What are the most commonly used Fibonacci ratios for channel construction and interpretation?
The most commonly used Fibonacci ratios for channel construction and interpretation are 0.618, 1.000, 1.618, and 2.618. The 1.000 line typically represents the initial width of the channel, while 0.618 often acts as an intermediate support/resistance level. The 1.618 and 2.618 levels are used as potential extension targets or strong resistance/support zones in robust trends.
5. Can Fibonacci Channels be used reliably for setting precise stop-loss and take-profit levels?
Yes, Fibonacci Channels can provide logical areas for setting stop-loss and take-profit levels, though precision often requires additional confirmation. For stop-loss, a common practice is to place it just beyond a channel boundary that is expected to hold as support or resistance. For take-profit, outer channel lines or extension levels (e.g., 1.618, 2.618) can serve as targets. However, always confirm these levels with other technical analysis tools and consider your personal risk tolerance.
6. How accurate are Fibonacci Channels as a predictive tool in technical analysis, and what are their limitations?
Fibonacci Channels can be highly accurate as a predictive tool when applied correctly in trending markets, especially when combined with other indicators. They offer a high probability of identifying dynamic support/resistance and potential trend continuations. Their limitations include reduced effectiveness in non-trending markets, subjectivity in anchor point selection, and the need for constant adjustment as market conditions evolve. No technical tool is 100% accurate, and channels should always be used as part of a broader analytical framework.
7. Which popular charting platforms (e.g., TradingView, MT5) offer the Fibonacci Channel tool, and how do I access it?
Most popular charting platforms offer the Fibonacci Channel tool. On TradingView, you can find it under the “Gann and Fibonacci Tools” section on the left-hand toolbar. On MT5 (MetaTrader 5), it’s typically located under “Insert” > “Objects” > “Fibonacci” > “Fibonacci Channel.” The exact path might vary slightly between versions, but it’s generally grouped with other Fibonacci tools.
8. What are the common pitfalls or mistakes traders make when applying Fibonacci Channels, and how can they be avoided?
- Incorrect Anchor Point Selection: Avoid choosing minor swings; always identify significant, clear pivots on higher timeframes.
- Over-Reliance: Never use channels in isolation. Always seek confluence with other indicators (RSI, MACD, volume, candlestick patterns).
- Ignoring Market Context: Do not apply channels in choppy or ranging markets where trends are not defined.
- Lack of Customization: Failing to adjust channel settings or extend lines can limit their utility.
9. Should Fibonacci Channels be combined with other technical indicators for better trading results?
Absolutely. Combining Fibonacci Channels with other technical indicators is highly recommended for better trading results. This practice, known as seeking confluence, strengthens the reliability of signals by requiring multiple tools to confirm the same bias. Indicators like RSI, MACD, volume, moving averages, and candlestick patterns can provide valuable confirmation for entry, exit, and reversal signals generated by the channel boundaries.
10. How do I adjust Fibonacci Channel settings and appearance for different timeframes or personal preferences?
You can adjust Fibonacci Channel settings by double-clicking on the channel itself (or right-clicking and selecting “Settings” or “Properties”). This will open a dialog box where you can customize line colors, thickness, style, and visibility for each Fibonacci level. Most platforms also allow you to extend the channel lines to the right for future projections. For different timeframes, you might need to redraw the channel with new anchor points that are significant for that specific timeframe, or you can adjust the visibility settings to show the channel only on relevant timeframes.
發佈留言
很抱歉,必須登入網站才能發佈留言。