
Average True Range: 7 Ways ATR Boosts Your Trading & Manages Risk
What is Average True Range (ATR)?

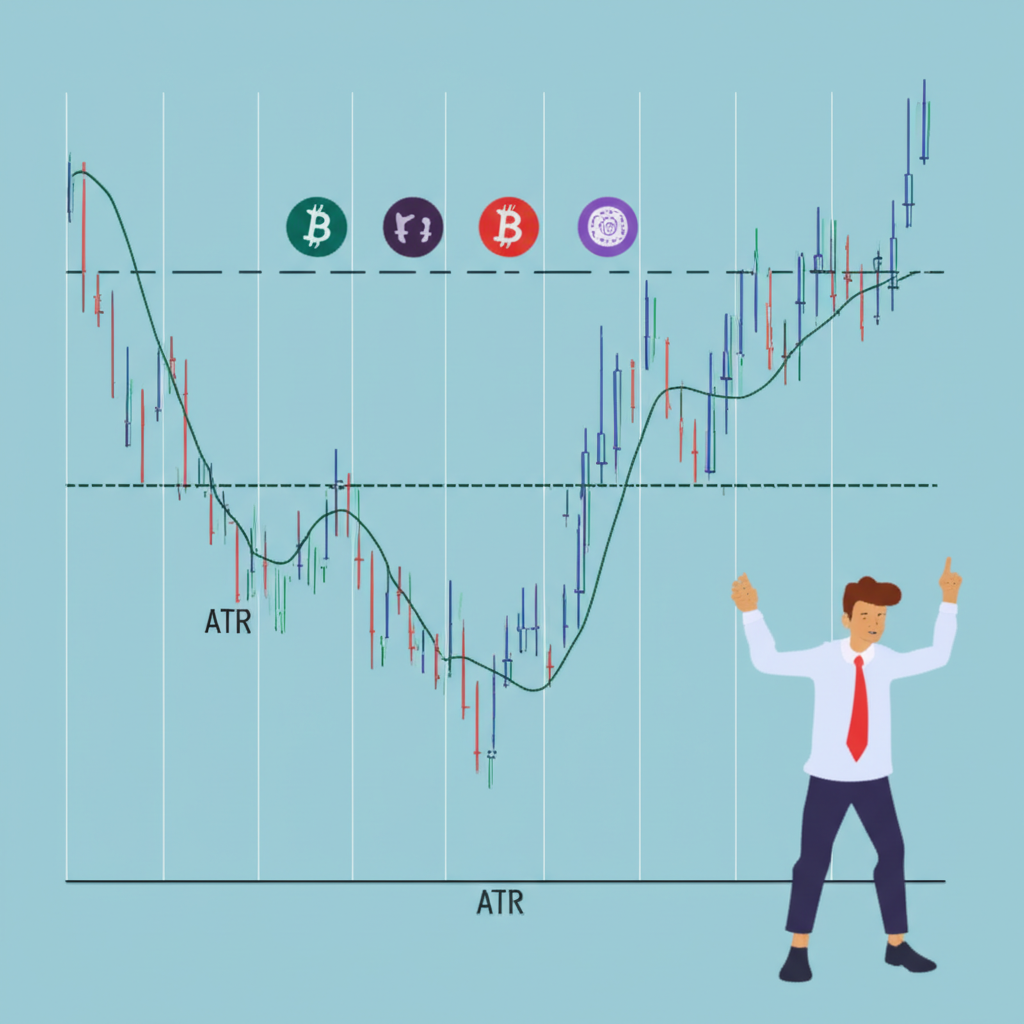
The Average True Range (ATR) stands as one of the most practical tools in technical analysis, offering traders a clear window into market volatility. Introduced by J. Welles Wilder Jr. in his groundbreaking1978 book *New Concepts in Technical Trading Systems*, ATR was originally designed for commodity traders who needed a reliable way to measure price fluctuations amid frequent gaps and limit moves. Over time, its application has broadened significantly—today, it’s widely used across stocks, forex, cryptocurrencies, and futures.
Unlike directional indicators such as moving averages or oscillators like RSI, ATR does not predict price movement. Instead, it focuses purely on the intensity of price swings over a defined period, typically calculated using a14-period average. This makes it an essential instrument for risk assessment, helping traders understand how much an asset tends to move on any given day—or hour, depending on the chart timeframe. A rising ATR signals increasing volatility, meaning larger-than-usual price ranges, while a declining ATR reflects calmer markets with tighter price action.
Understanding True Range: The Foundation of ATR Calculation
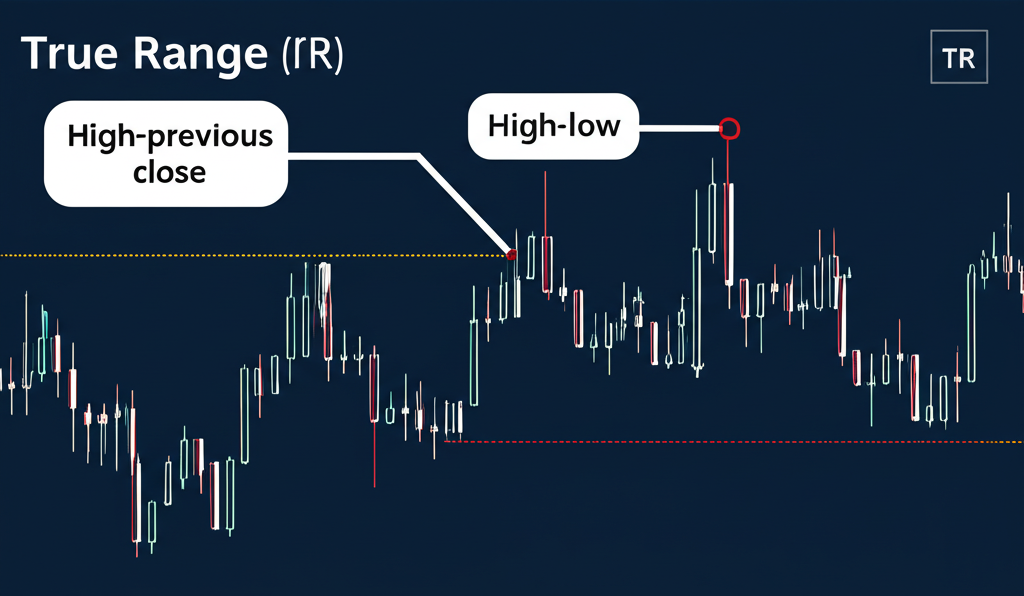
Before ATR can be computed, we must first grasp the concept of True Range—the raw measure of volatility used in its calculation. Standard high-minus-low range fails to account for gaps between trading sessions, especially when an asset opens significantly higher or lower than the previous close. To address this limitation, Wilder introduced True Range, which captures three possible scenarios to ensure no significant price movement goes unmeasured:
- Current High minus Current Low: This reflects the intraday trading range—the conventional way of measuring volatility within a single period.
- Absolute value of Current High minus Previous Close: This accounts for upward gaps, such as when news over the weekend causes a stock to open sharply higher.
- Absolute value of Current Low minus Previous Close: This handles downward gaps, like a gap-down open following poor earnings results.
The True Range is simply the largest of these three values. By incorporating gaps, it offers a more complete picture of actual market movement, making it far more accurate than basic range calculations, especially in fast-moving or overnight-traded markets.
For example, consider two consecutive trading days:
- Day1: High = $105, Low = $100, Close = $104
- Day2: High = $108, Low = $102, Close = $107 (Previous Close = $104)
The three components for Day2 are:
- High – Low = $108 – $102 = $6.00
- |High – Previous Close| = |$108 – $104| = $4.00
- |Low – Previous Close| = |$102 – $104| = $2.00
Since $6.00 is the greatest value, the True Range for Day2 is $6.00. This method ensures that even if a price jumps overnight, the volatility metric reflects the full extent of that move.
How to Calculate Average True Range (ATR)
Once True Range values are determined for each period, the Average True Range is derived by smoothing them over time. While some platforms use a simple moving average (SMA), Wilder proposed an exponential smoothing technique that gives more weight to recent data, allowing ATR to adapt quickly to changing market conditions.
The process unfolds in two stages:
Initial ATR (First N Periods):
For the first calculation, sum up the first14 True Range values and divide by14 (or whatever period you choose):
$$\text{ATR} = \frac{\sum_{i=1}^{14} \text{TR}_i}{14}
$$
Subsequent ATR (Smoothed Average):
From the15th period onward, Wilder’s formula applies:
$$\text{ATR}_{\text{current}} = \frac{(\text{ATR}_{\text{previous}} \times13) + \text{TR}_{\text{current}}}{14}
$$
This recursive formula means each new ATR value builds on the prior one, creating a responsive yet stable line that tracks evolving volatility without overreacting to isolated spikes.
Here’s a simplified example using a3-period ATR:
| Period | High | Low | Close | Previous Close | TR Calculation | True Range (TR) | ATR (3-period) |
|---|---|---|---|---|---|---|---|
| 1 | 105 | 100 | 104 | – | H-L:5, |H-PC|: -, |L-PC|: – | 5 | – |
| 2 | 108 | 102 | 107 | 104 | H-L:6, |H-PC|:4, |L-PC|:2 | 6 | – |
| 3 | 110 | 106 | 109 | 107 | H-L:4, |H-PC|:3, |L-PC|:3 | 4 | (5+6+4)/3 =5 |
| 4 | 112 | 107 | 111 | 109 | H-L:5, |H-PC|:3, |L-PC|:2 | 5 | ((5 ×2) +5) /3 =5 |
By the fourth period, the smoothed ATR remains at5, showing how the indicator evolves gradually. In real-world trading, platforms like TradingView or MetaTrader handle these calculations automatically, displaying ATR as a line graph beneath the price chart—freeing traders to focus on interpretation rather than arithmetic.
Interpreting Average True Range Values
Interpreting ATR comes down to understanding what the numbers represent in context. Since ATR measures absolute volatility in price units (dollars, pips, etc.), its value must always be assessed relative to the asset’s price level and historical behavior.
- High ATR: Indicates strong price swings and increased market activity. This often occurs during news events, earnings reports, or shifts in investor sentiment. High volatility can mean bigger profit opportunities—but also greater risk. Traders may widen their stop-losses and adjust position sizes accordingly.
- Low ATR: Reflects subdued movement, commonly seen during consolidation phases or low-volume periods. A prolonged low ATR might suggest the market is “coiling up,” potentially setting the stage for a sharp breakout. Range-bound strategies may work well here, or traders might wait for a volatility expansion before entering new positions.
Crucially, ATR provides no insight into direction. A high reading could accompany a powerful uptrend, a volatile downtrend, or wild sideways action. Its sole purpose is to quantify the size of price changes, not their trajectory. That said, a sudden spike in ATR can serve as an early warning of accelerating momentum—often preceding significant price moves.
Context is key. An ATR of $3 means very different things for a $15 stock versus a $300 stock. Similarly,50 pips in USD/JPY represents more movement than50 pips in EUR/USD due to differing average daily ranges. Savvy traders compare current ATR to historical norms and consider percentage-based volatility (ATR divided by price) for cross-asset comparisons.
Practical Applications of ATR in Trading
Far from being just a theoretical metric, ATR delivers actionable insights across multiple facets of trading—from setting stops to sizing positions and managing exits. Its ability to adapt to shifting market conditions makes it indispensable for disciplined risk management.
Using ATR for Stop-Loss Placement
One of ATR’s most powerful uses is in crafting dynamic stop-loss orders. Fixed stops—like “$1 below entry”—often fail because they don’t account for natural volatility. In a highly volatile market, such a stop might get triggered by normal noise rather than a failed trade idea.
An ATR-based stop adjusts automatically. A common approach is to place the stop at1.5x,2x, or even3x the current ATR away from the entry point. This ensures the stop is wide enough to survive routine fluctuations but tight enough to limit losses if the trade moves decisively against you.
Example:
Stock price: $100
14-period ATR: $2.00
ATR multiplier:2x
- Long position stop-loss: $100 – (2 × $2.00) = $96.00
- Short position stop-loss: $100 + (2 × $2.00) = $104.00
This method keeps risk aligned with current market dynamics, reducing both premature exits and excessive exposure.
Determining Position Size with ATR
Position sizing is where ATR truly shines in portfolio risk management. The goal is to risk a consistent dollar amount per trade—say,1% of capital—regardless of whether you’re trading a calm utility stock or a wild crypto asset.
The formula is straightforward:
$$\text{Position Size} = \frac{\text{Dollar Risk per Trade}}{\text{ATR} \times \text{Multiplier}}
$$
Example:
Total capital: $20,000
Risk per trade:1% = $200
Stock ATR: $1.50
Stop-loss set at2x ATR → $3.00 risk per share
$$\text{Position Size} = \frac{200}{3} \approx66 \text{ shares}
$$
This ensures that every trade carries roughly the same risk profile, promoting consistency and long-term sustainability. As highlighted by Investopedia, effective position sizing separates amateur traders from professionals.
Identifying Entry and Exit Signals
While ATR doesn’t generate direct buy/sell signals, it enhances decision-making when combined with other tools. For entries, a rising ATR during a breakout adds confidence that the move has conviction. Conversely, a very low ATR might signal a market at rest, hinting at an upcoming surge in activity.
For exits, falling ATR can suggest waning momentum, prompting profit-taking before a reversal. But its most effective exit application lies in trailing stops.
ATR for Volatility-Adjusted Trailing Stops
Trailing stops lock in profits while giving trades room to breathe. A fixed percentage trail can be too rigid—tight in calm markets, too loose in volatile ones. An ATR-based trail adapts seamlessly.
A popular version is the Chandelier Exit, which sets the trailing stop at a multiple of ATR below the highest high (for longs) or above the lowest low (for shorts) since entry.
Example (Chandelier Exit – Long Trade):
Entry: $50.00
Highest high since entry: $60.00
Current ATR: $1.00
Multiplier:3
$$\text{Stop Level} =60 – (1 \times3) = \$57.00$$
As the price climbs and sets new highs, the stop trails upward. This lets traders ride strong trends while minimizing the risk of giving back gains during pullbacks. According to BabyPips, ATR-based trailing stops are especially effective in trending environments.
Optimizing Your ATR Settings: Finding the “Best” Period
Many traders ask: What’s the best ATR setting? The answer isn’t universal—it depends on your trading style, timeframe, and the asset class.
Wilder’s default14-period setting remains popular because it balances sensitivity and smoothness. But customization often yields better results:
- Scalping (1–5 minute charts): Use shorter periods (5–10) to react quickly to intraday volatility shifts.
- Day Trading: A7–14 period ATR helps filter out noise while capturing meaningful swings within the session.
- Swing Trading: The14-period setting works well, though some traders prefer14–20 to smooth out daily fluctuations.
- Long-Term Investing or Trend Following: Longer settings (20–50) reduce sensitivity to short-term noise, focusing on broader volatility trends.
The optimal setting should be validated through backtesting. Try different periods on historical data and evaluate how they affect stop-loss hit rates, position sizing accuracy, and overall performance. The aim is to find a sweet spot—responsive enough to reflect real changes, but stable enough to avoid whipsaws.
Common Mistakes and Misconceptions When Using ATR
Despite its usefulness, ATR is often misused. Avoiding these pitfalls will improve your trading outcomes:
- Mistaking ATR for a directional signal: High ATR means large moves—but not necessarily up or down. Never assume a breakout is confirmed just because ATR is rising.
- Using the same setting across timeframes: A14-period ATR on a daily chart behaves very differently than on a5-minute chart. Adjust your settings based on your trading horizon.
- Ignoring asset-specific volatility: A2x ATR stop may be reasonable for EUR/USD but dangerously wide for gold or Bitcoin. Know your market’s typical behavior.
- Trading based on ATR alone: Always combine ATR with price action, trend analysis, or other indicators. It should inform your decisions, not dictate them.
- Using arbitrary multipliers: While2x ATR is common, test values like1.5x or3x to see what fits your risk tolerance and strategy.
- Confusing ATR with volume: Volume shows participation; ATR shows movement. A high-volume, low-ATR day suggests tight trading. A low-volume, high-ATR session might indicate panic or thin liquidity.
By recognizing these traps, you can integrate ATR more effectively into your system—leveraging it for smarter risk control without overrelying on its signals.
ATR Across Different Markets: Stocks, Forex, Crypto, and Commodities
The core function of ATR—measuring price range—is consistent across markets, but its interpretation varies due to differing scales and behaviors.
- Stocks: Expressed in dollars, ATR helps assess individual stock risk. A penny stock with a $0.30 ATR may be extremely volatile in percentage terms, while a large-cap with a $5 ATR could be relatively stable. Earnings season often causes ATR spikes.
- Forex: Measured in pips, ATR varies by currency pair. Majors like EUR/USD typically have lower ATRs than exotics like USD/ZAR. Traders use it to set pip-based stops and manage risk during high-impact news events.
- Cryptocurrencies: Known for extreme moves, cryptos like Bitcoin or Solana can have ATRs in the hundreds of dollars on daily charts. This demands wider stops and conservative position sizing to survive normal swings.
- Commodities: As the original target market for ATR, commodities like crude oil and wheat are prone to gaps due to geopolitical or weather events. ATR excels here by capturing those jumps and helping traders avoid being stopped out prematurely.
The takeaway: ATR values must always be interpreted within their market context. What seems high in one asset may be normal in another. Smart traders normalize ATR by price or compare it to historical averages for meaningful insights.
Integrating ATR with Other Technical Indicators
ATR reaches its full potential when paired with other tools. Used in isolation, it’s informative but limited. Combined with trend, momentum, or pattern-based signals, it becomes a powerful filter and confirmation mechanism.
- With Moving Averages: When price breaks above a50-day MA, a rising ATR confirms strong momentum. If ATR is flat or falling, the breakout may lack strength and could fail.
- With RSI or Stochastic: An overbought RSI reading with a declining ATR suggests fading momentum—possibly a sign to take profits. Conversely, a rising ATR with extreme RSI might signal strong continuation potential.
- With Support and Resistance: A breakout from a key level backed by expanding ATR is more likely to succeed. A breakout with shrinking ATR raises suspicion of a false move.
- With Chart Patterns: Triangles, flags, and rectangles often resolve with increased volatility. ATR expansion upon breakout validates the pattern’s reliability.
A robust strategy might look like this: Enter long when price clears a resistance level, RSI is above50 but not overbought, and ATR is rising. Set the stop at2x ATR below entry and trail it upward as the trade progresses. This combines direction, momentum, and volatility into a cohesive plan.
Limitations of Average True Range
No indicator is perfect, and ATR is no exception. Being aware of its constraints helps prevent misuse:
- It’s a lagging indicator: ATR is based on past prices. While it reflects current volatility well, it cannot predict sudden spikes or crashes in real time.
- No directional insight: It tells you how much the market is moving, not which way. A high ATR could mean chaos in either direction.
- Requires normalization: Raw ATR values are meaningless without context. Always compare to price and historical levels.
- Not a standalone signal: ATR should support—not replace—your core strategy. It enhances risk management but doesn’t generate trades on its own.
- Sensitive to period choice: A poorly chosen setting can make ATR either too jittery or too sluggish, reducing its effectiveness.
- Smoothing delays response: Because it’s an average, ATR may not fully reflect a massive gap until several periods later, though True Range itself captures the initial jump.
In summary, ATR is a cornerstone of modern volatility analysis. When used thoughtfully—as part of a broader toolkit—it empowers traders to navigate markets with greater precision, discipline, and confidence.
What does the average true range tell you about market volatility?
The Average True Range (ATR) directly quantifies market volatility. A high ATR value indicates that an asset’s price is experiencing larger average price swings, implying high volatility. Conversely, a low ATR value suggests smaller average price swings, indicating low volatility or a period of consolidation. It tells you the typical range of price movement over a given period, allowing traders to gauge the market’s “choppiness” or “smoothness.”
What is the best ATR setting for day trading versus swing trading?
There’s no single “best” ATR setting, as it depends on individual preferences and market conditions. However, general guidelines suggest:
- Day Trading: Shorter periods (e.g.,5 to10) are often preferred. These settings make ATR more sensitive to recent price action, which is crucial for capturing short-term movements and managing tight risk within a single trading day.
- Swing Trading: Standard periods (e.g.,10 to20) are common. The default14-period setting often works well for swing traders, as it provides a balanced view of volatility over several days to weeks, smoothing out some of the intraday noise.
Ultimately, traders should test different settings to find what works best for their specific strategy and the assets they trade.
How can I use ATR effectively in my trading strategy for entry and exit points?
While ATR is primarily a volatility measure, it can inform entry and exit points:
- Entries: A rising ATR during a breakout can confirm the strength of the move, suggesting a genuine trend initiation. Conversely, a very low ATR might signal market consolidation, hinting at a potential breakout soon.
- Exits (Stop-Losses): ATR is excellent for setting dynamic stop-loss orders. You can place your stop at a multiple of ATR (e.g.,1.5x or2x ATR) away from your entry price.
- Exits (Trailing Stops): Use ATR to create volatility-adjusted trailing stops, such as the Chandelier Exit, which moves the stop as the price trends favorably, protecting profits while allowing room for normal fluctuations.
Can you provide a practical example of how ATR is calculated and applied?
Calculation Example: For a14-period ATR, you first calculate the “True Range” (TR) for each period. TR is the greatest of:1) Current High – Current Low,2) |Current High – Previous Close|,3) |Current Low – Previous Close|. Once you have14 TR values, the ATR is the14-period moving average of these TRs. For subsequent periods, a smoothing formula is used, giving weight to the previous ATR and current TR.
Application Example (Position Sizing): If your risk per trade is $100 and a stock’s14-period ATR is $2.00, and you want a2x ATR stop-loss, your stop-loss distance is $4.00 ($2.00 x2). Your position size would be $100 / $4.00 =25 shares. This ensures you risk a consistent dollar amount per trade.
What is the formula for Average True Range and True Range?
True Range (TR): The greatest of the following three values:
- Current High – Current Low
- Absolute Value of Current High – Previous Close
- Absolute Value of Current Low – Previous Close
Average True Range (ATR):
- Initial ATR (for the first N periods): Sum of the first N True Ranges / N
- Subsequent ATR (Wilder’s Smoothing Method): $\text{ATR}_{\text{current}} = \frac{(\text{ATR}_{\text{previous}} \times (N -1)) + \text{TR}_{\text{current}}}{N}$
Where N is the lookback period (e.g.,14).
How do I configure and use Average True Range on platforms like TradingView?
On most charting platforms like TradingView, you can add ATR as an indicator:
- Open your chart and click on the “Indicators” or “Fx” button.
- Search for “Average True Range” or “ATR” and select it.
- The indicator will appear below your price chart.
- To configure, click on the settings icon (often a gear symbol) next to the ATR indicator name.
- Here you can adjust the “Length” or “Period” (default is usually14) and sometimes the smoothing method.
Once configured, you can visually observe the ATR line and its values to gauge volatility for the chosen asset and timeframe.
What are the common strategies for using Average True Range, especially for stop-loss?
Common ATR strategies include:
- Dynamic Stop-Losses: Place your stop-loss order at a multiple (e.g.,1.5x,2x, or3x) of the current ATR value away from your entry price. This adapts your stop to current market volatility.
- Position Sizing: Calculate your position size based on your risk per trade and the ATR-adjusted stop-loss distance. This ensures consistent risk exposure across different trades.
- Volatility-Adjusted Trailing Stops: Use ATR to trail your stop-loss as the price moves in your favor, protecting profits while allowing for normal price fluctuations (e.g., Chandelier Exit).
- Breakout Confirmation: Look for an increase in ATR when a price breaks out of a consolidation pattern or key support/resistance level, confirming the strength of the move.
Is there an Average True Range calculator available, and how does it work?
Yes, most charting platforms (like TradingView, MetaTrader, Thinkorswim) have built-in ATR calculators. When you add the ATR indicator to your chart, the platform automatically performs the complex calculations based on the price data and your chosen period setting. You don’t need a separate manual calculator for day-to-day trading. The platform displays the ATR value as a line on the indicator panel, which updates with each new period.
How do I set a stop-loss using the Average True Range indicator?
To set an ATR-based stop-loss:
- Identify the current ATR value for your asset on your chosen timeframe.
- Choose an ATR multiplier based on your strategy and risk tolerance (e.g.,1.5,2, or3).
- Calculate your stop-loss distance: ATR value x Multiplier.
- For a long trade: Entry Price – (ATR x Multiplier).
- For a short trade: Entry Price + (ATR x Multiplier).
This creates a dynamic stop-loss that adjusts to the market’s current volatility, preventing premature exits from normal price fluctuations.
What is considered a “good” Average True Range value, and how does it relate to price action?
There isn’t a universally “good” ATR value; it’s always relative to the asset’s price, its historical ATR, and the market context. A “good” ATR value is one that aligns with your trading strategy:
- High ATR: Indicates strong price action and high volatility. This might be “good” for breakout traders or those seeking larger potential moves, but also implies higher risk.
- Low ATR: Suggests weak price action and low volatility. This might be “good” for range traders or those anticipating a breakout from consolidation, but could mean limited profit potential during the quiet phase.
ATR should always be considered in relation to the asset’s price. For example, an ATR of $0.50 for a $5 stock signifies much higher percentage volatility than $0.50 for a $100 stock. The “goodness” is in how it fits your trading objectives and risk management.
發佈留言
很抱歉,必須登入網站才能發佈留言。