Europe Stock Market Index: 7 Key Benchmarks to Navigate European Investments
Table of Contents
ToggleIntroduction: Understanding the European Stock Market Index Landscape

European stock market indices serve as essential barometers of economic vitality and corporate performance across the continent. More than just numerical aggregates, these indices encapsulate the collective movement of selected equities, offering investors and analysts a concise reflection of market sentiment and macroeconomic trends. In a region marked by economic integration yet shaped by national diversity, indices play a pivotal role in guiding investment decisions, benchmarking portfolio returns, and informing policy. Whether tracking the pulse of the eurozone or monitoring national economic champions, understanding the structure and behavior of European indices is crucial for navigating one of the world’s most influential financial ecosystems.
The Pillars of European Finance: Major Stock Market Indices

The European financial landscape is anchored by a diverse network of stock market indices, each designed to represent distinct segments of the market—be it geography, sector, or company size. These benchmarks are widely followed by institutional investors, policymakers, and global market participants seeking insight into regional economic dynamics. From pan-European composites to nationally focused gauges, these indices offer layered perspectives on equity performance and investor confidence.
Euro Stoxx 50: The Eurozone’s Blue Chip Benchmark
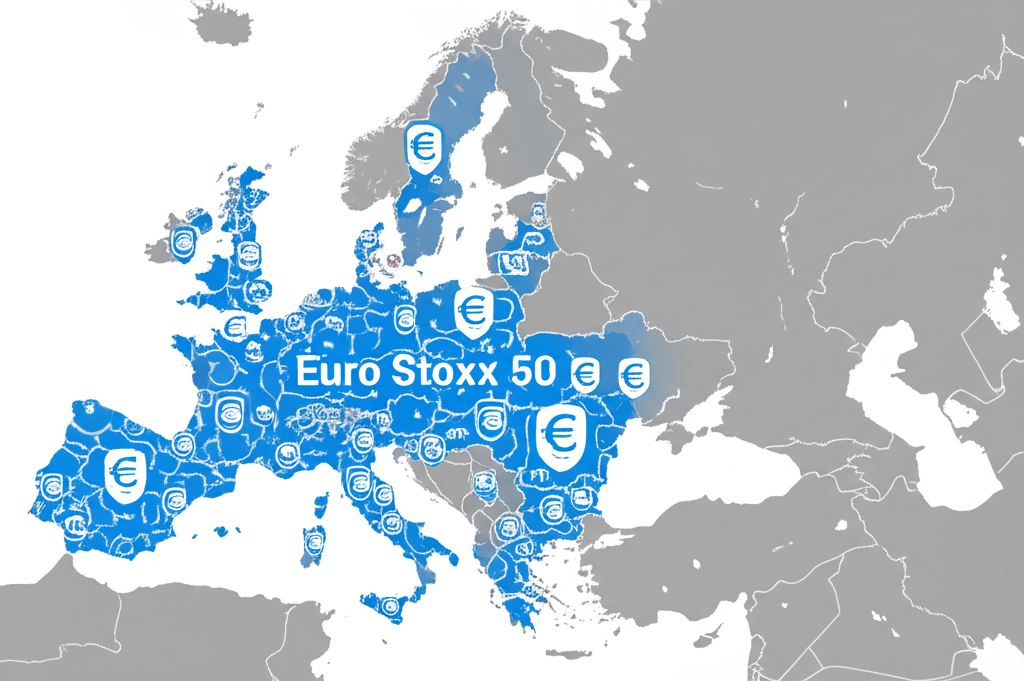
The Euro Stoxx 50 stands as the premier benchmark for large-cap stocks within the Eurozone. Introduced in 1998, it includes 50 of the most significant and actively traded companies from euro-using economies such as Germany, France, Italy, Spain, and the Netherlands. The index is carefully curated based on market capitalization and liquidity, with strict caps on individual stock weightings to prevent dominance by a single firm and ensure balanced representation. As a performance-driven gauge, it often serves as the foundation for derivatives contracts and passively managed investment products. Its movements are closely watched as a proxy for the broader health of the eurozone economy, particularly during periods of monetary policy shifts or fiscal uncertainty.

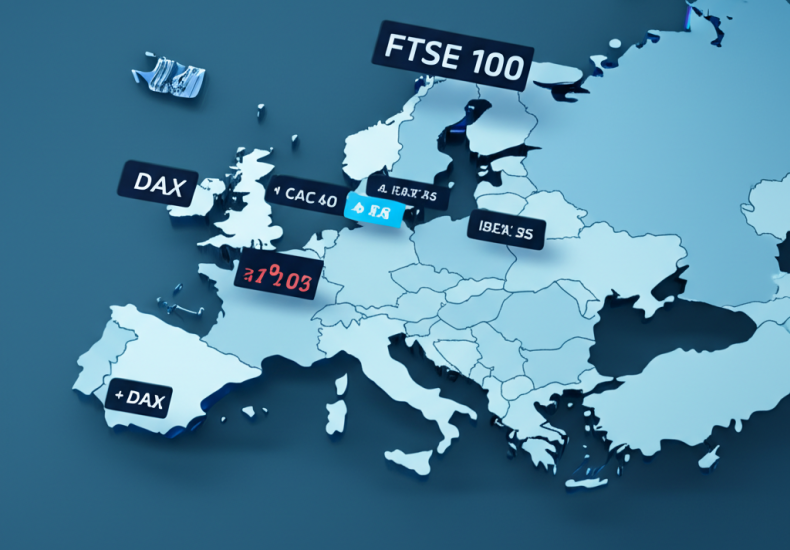
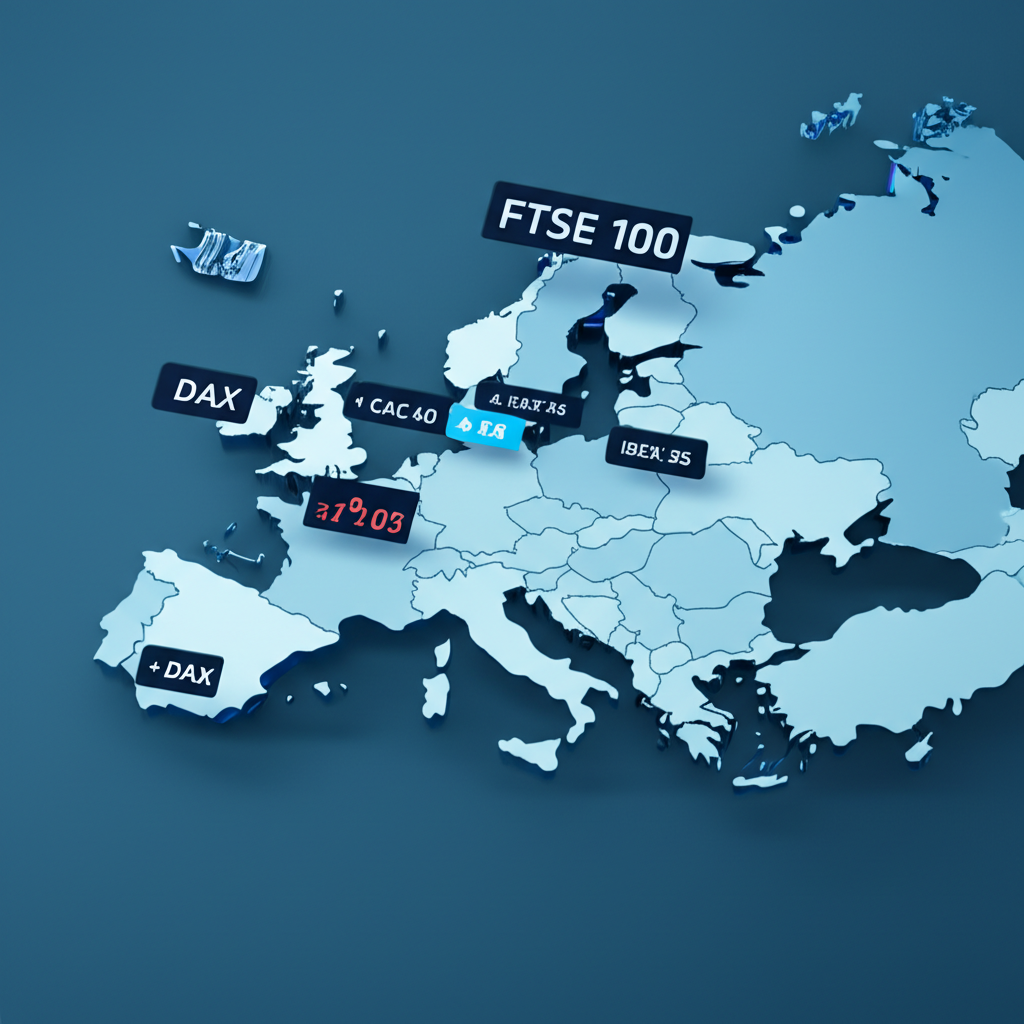
FTSE 100: London’s Leading Indicator
The FTSE 100, commonly referred to as the “Footsie,” is the flagship index of the UK equity market. Maintained by the London Stock Exchange Group, it tracks the 100 largest companies listed on the exchange by market capitalization. Despite its domestic roots, the FTSE 100 has a distinctly global character—many of its constituents generate the majority of their revenue overseas, particularly in commodities, finance, and pharmaceuticals. This international exposure makes the index sensitive to foreign exchange rates and global commodity prices. As a result, it functions not only as a barometer of UK economic conditions but also as a litmus test for global investor sentiment toward British multinational enterprises.
DAX 40: Germany’s Economic Barometer
The DAX 40, expanded from its original 30 constituents in 2021, reflects the performance of Germany’s 40 most prominent and liquid companies traded on the Frankfurt Stock Exchange. Unlike many price-based indices, the DAX is a total return index, meaning it incorporates reinvested dividends, offering a more comprehensive view of investor returns over time. Given Germany’s status as Europe’s largest economy and a manufacturing powerhouse, the DAX 40 is often seen as a leading indicator of industrial strength and export competitiveness. Its composition spans key sectors including automotive, engineering, chemicals, and healthcare, making it particularly sensitive to global trade flows and supply chain developments.
CAC 40, AEX, IBEX 35, SMI: Other Key Regional Powerhouses
Beyond the most prominent indices, several national benchmarks provide critical insights into their respective economies:
- CAC 40 (France): This index includes the 40 largest companies listed on Euronext Paris, serving as a primary indicator of French corporate performance and economic direction. Heavily weighted toward luxury goods, finance, and energy, it reflects both domestic stability and France’s global brand influence.
- AEX Index (Netherlands): Comprising the 25 most significant Dutch equities on Euronext Amsterdam, the AEX captures the performance of a trade-reliant, innovation-driven economy. It includes major players in technology, agriculture, and financial services, including multinational giants like ASML and Unilever.
- IBEX 35 (Spain): Representing the 35 most liquid stocks on the Madrid Stock Exchange, the IBEX 35 is Spain’s main equity benchmark. It is notably influenced by sectors such as banking, utilities, and tourism, making it vulnerable to regional economic cycles and seasonal fluctuations.
- SMI (Switzerland): The Swiss Market Index tracks the 20 largest and most liquid Swiss equities, with a strong emphasis on pharmaceuticals, financials, and precision manufacturing. As Switzerland remains outside the EU but deeply integrated into European markets, the SMI offers a unique blend of stability and innovation, often attracting safe-haven capital during times of geopolitical tension.
Together, these indices form a mosaic of national economic narratives, each contributing to the broader understanding of European market dynamics.
MSCI Europe Index: A Broader Pan-European View
For investors seeking exposure beyond individual nations or the eurozone, the MSCI Europe Index offers a comprehensive, pan-continental perspective. This market-capitalization-weighted, float-adjusted index captures the performance of developed-market equities across 15 European countries, including both EU members and non-EU nations such as Switzerland, Norway, and the UK. By encompassing a wider geographic and sectoral range, it provides a more holistic benchmark for institutional portfolios. Its methodology ensures representation across market caps and industries, making it a preferred tool for global asset allocators aiming to balance regional exposure while minimizing concentration risk.
Live European Market Performance and Historical Data
Effective investment decision-making requires a dual lens: real-time monitoring of market movements and a deep understanding of historical context. While live data reveals immediate reactions to news and events, historical analysis helps identify long-term patterns, structural shifts, and cyclical behavior. Together, they empower investors to distinguish between noise and meaningful market trends.
Where to Find Live European Stock Market Index Data
Timely and accurate data on European indices is accessible through a range of trusted financial platforms. Bloomberg, Reuters, Financial Times, and Yahoo Finance offer up-to-the-minute updates, interactive charts, and analytical tools tailored to both professional traders and retail investors. In addition, official exchange websites—including the London Stock Exchange, Deutsche Börse, and Euronext—publish real-time or near-real-time index values, constituent information, and trading volumes. Many of these platforms also provide mobile alerts, customizable dashboards, and API access, enabling users to track multiple indices simultaneously and respond swiftly to market developments.
Interpreting Real-Time Index Movements
Real-time index fluctuations are more than simple up-or-down indicators—they reflect the collective psychology of market participants. A sustained rally may signal confidence in corporate earnings, favorable inflation data, or dovish monetary policy expectations. Conversely, sharp declines often stem from negative economic surprises, geopolitical escalations, or central bank hawkishness. Traders should pay close attention to volume, volatility, and intra-day price ranges. High volume accompanying a price move suggests strong conviction, while low volume may indicate hesitation or short-term positioning. Sudden spikes or gaps frequently follow major announcements, such as ECB rate decisions or US nonfarm payroll reports, underscoring the interconnectedness of global markets.
Analyzing Historical Trends: What the Past Tells Us
Historical data is an invaluable resource for contextualizing current market conditions. Long-term charts of indices like the Euro Stoxx 50 reveal how markets have weathered past crises—from the 2008 global financial meltdown to the 2020 pandemic shock—and the speed and nature of their recoveries. For instance, during the post-2009 recovery, financial and industrial sectors led the rebound, whereas in the aftermath of the 2020 crisis, digital transformation and healthcare innovation drove gains. Seasonal patterns—such as the traditional “Santa Rally” in December or weaker summer performance—also emerge over time. Furthermore, historical analysis aids in stress-testing investment strategies, evaluating risk-adjusted returns, and understanding how different asset classes correlate under various macroeconomic regimes.
Factors Driving European Stock Market Indices
The trajectory of European indices is shaped by a complex interplay of macroeconomic forces, political developments, and corporate fundamentals. Recognizing these drivers allows investors to anticipate shifts and adjust portfolios accordingly.
Economic Indicators: GDP, Inflation, Interest Rates
Macroeconomic data forms the bedrock of market expectations. GDP growth signals economic expansion and supports higher corporate earnings, typically lifting equity valuations. Conversely, stagnation or contraction raises recession concerns, prompting risk-off behavior. Inflation plays a dual role: moderate levels suggest healthy demand, but persistent or rising prices erode real returns and prompt central banks to tighten policy. The European Central Bank (ECB) closely monitors inflation when setting interest rates, which directly affect borrowing costs for businesses and consumers. Higher rates can dampen growth and reduce equity attractiveness relative to fixed-income assets, while lower rates tend to stimulate spending and investment, supporting higher stock prices.
Geopolitical Events & Policy Decisions
Europe’s markets are particularly sensitive to political and regulatory developments. EU-wide policies on climate transition, digital taxation, and banking supervision can reshape entire industries. The 2016 Brexit referendum, for example, triggered prolonged volatility in the FTSE 100 and highlighted currency risks for multinational firms. Regional instability—such as energy supply disruptions due to geopolitical conflicts—can also impact market sentiment. Elections in major economies like Germany, France, or Italy are closely watched for potential shifts in fiscal direction or EU integration. Additionally, trade relations with the US, China, and emerging markets influence export-oriented sectors such as German automakers or French luxury brands.
Corporate Earnings and Sectoral Performance
At its core, an index reflects the financial health of its underlying companies. Quarterly earnings reports are among the most influential market-moving events. Positive surprises—especially in revenue growth, margin expansion, or guidance—can propel stocks higher and lift entire indices. Conversely, missed expectations, particularly among large-cap constituents, can trigger broad sell-offs. Sector rotation also plays a critical role: when technology outperforms, indices with significant tech exposure, such as the AEX (driven by ASML), benefit disproportionately. In contrast, a downturn in banking profits can weigh heavily on indices like the CAC 40 or IBEX 35, where financials hold substantial weight. Investors must therefore monitor not only aggregate earnings but also sector-specific trends and earnings quality.
Investing in European Stock Market Indices: Your Options
Gaining exposure to European equities through index-linked investments has become increasingly accessible, thanks to a range of modern financial instruments. Each option offers different trade-offs in terms of cost, liquidity, and control.
Index Funds and ETFs: Accessible European Exposure
For most investors, index funds and ETFs provide the most practical route to diversified European market exposure. These vehicles replicate the performance of a specific index, minimizing active management risk and reducing costs.
| Investment Vehicle | Description | Pros | Cons |
|---|---|---|---|
| Index Funds | Mutual funds that track a specific index, holding a portfolio of stocks designed to mirror the index’s performance. | Low management fees, broad diversification, professional management, suitable for long-term investing. | Traded once a day (NAV at market close), less liquid than ETFs, potential for minimum investment requirements. |
| ETFs | Funds that hold assets like stocks, bonds, or commodities, and trade on exchanges like individual stocks throughout the day. | Low management fees, intra-day trading flexibility, broad diversification, transparency, often no minimum investment. | Can incur brokerage commissions for each trade, potential for wider bid-ask spreads, active trading can lead to suboptimal returns. |
Popular European-focused ETFs include the iShares Core Euro STOXX 50 UCITS ETF, which tracks the eurozone’s largest firms, the Vanguard FTSE 100 UCITS ETF for UK exposure, and the iShares Core MSCI Europe UCITS ETF for broad regional diversification. When selecting a fund, investors should evaluate expense ratios, tracking accuracy, average daily volume, and replication method (physical vs. synthetic).
Direct Stock Investment vs. Index Tracking
Choosing between buying individual stocks and investing via index funds involves a fundamental trade-off between control and diversification.
- Direct Stock Investment: Allows investors to handpick companies they believe will outperform. This approach can yield outsized returns if successful but exposes portfolios to single-stock risk. It demands substantial research, ongoing monitoring, and emotional discipline, especially during market swings.
- Index Tracking: Offers instant diversification across dozens or hundreds of companies, reducing idiosyncratic risk. It follows a rules-based strategy, minimizing behavioral pitfalls and typically delivering returns close to the market average. For long-term investors prioritizing consistency and simplicity, index tracking often proves more effective than stock-picking.
The optimal choice depends on an investor’s knowledge, time horizon, risk tolerance, and belief in their ability to beat the market.
Understanding Risk Factors in European Investments
While European markets offer stability and income potential, they come with distinct risks that require careful consideration:
- Currency Risk: Non-euro investors face exchange rate fluctuations that can amplify or erode returns. A strengthening euro benefits foreign investors, while depreciation can offset gains.
- Political Risk: Europe’s multi-country structure introduces complexity. National elections, referendums, or debates over EU fiscal integration can create uncertainty, particularly in countries with high public debt or populist movements.
- Economic Volatility: Despite institutional strength, disparities in growth rates, labor markets, and debt levels persist across member states. Events like the 2010–2012 sovereign debt crisis highlight the potential for contagion within the eurozone.
- Regulatory Changes: Evolving frameworks in areas like data privacy (GDPR), financial reporting, and ESG disclosure can impact corporate operations, especially in tech, finance, and energy sectors.
A well-structured investment approach accounts for these risks through diversification, hedging strategies, and ongoing monitoring.
European vs. Global Indices: A Comparative Analysis
Placing European markets in a global context helps investors make informed allocation decisions and understand relative value opportunities.
European Indices vs. US Indices (e.g., Dow Jones, S&P 500)
Comparing European benchmarks like the Euro Stoxx 50 or FTSE 100 with US indices such as the S&P 500 reveals structural and performance differences:
| Feature | European Indices (e.g., Euro Stoxx 50) | US Indices (e.g., S&P 500) | |||||||||||||||||||||||||||||||||||||||||
|---|---|---|---|---|---|---|---|---|---|---|---|---|---|---|---|---|---|---|---|---|---|---|---|---|---|---|---|---|---|---|---|---|---|---|---|---|---|---|---|---|---|---|---|
| Sector Composition | Often higher weighting in financials, industrials, and consumer staples. Value-oriented. | Higher weighting in technology, healthcare, and growth-oriented sectors. Growth-oriented. | |||||||||||||||||||||||||||||||||||||||||
| Market Capitalization | Generally smaller aggregate market capitalization compared to the US market. | Largest and most liquid equity market globally, with enormous aggregate market capitalization. | |||||||||||||||||||||||||||||||||||||||||
| Growth Trajectory | Historically, European markets have often exhibited slower growth compared to US markets over the past decade, though this can vary. | Strong growth driven by innovation and large tech companies, particularly in recent years. | |||||||||||||||||||||||||||||||||||||||||
| Dividend Yield | Typically higher dividend yields, attractive to income-focused investors. | Generally lower dividend yields, with more emphasis on capital appreciation. | |||||||||||||||||||||||||||||||||||||||||
| Currency Influence | Strongly influenced by Eurozone economic
You may also likeCalendar
| ||||||||||||||||||||||||||||||||||||||||||
發佈留言
很抱歉,必須登入網站才能發佈留言。