
FTSE Meaning Explained: Understanding the FTSE 100 Index
“`html
Table of Contents
ToggleUnderstanding the FTSE 100 Index: Meaning, Mechanics, and Market Impact
Welcome to a deep dive into the heart of the UK stock market: the FTSE 100 Index. For many, this index, often affectionately known as the ‘Footsie’, is the primary yardstick for measuring the health and performance of Britain’s largest companies. Whether you’re new to investing or looking to refine your trading strategies, understanding the nuances of this benchmark is absolutely essential. We’re here to guide you through its history, structure, and the many forces that make it tick.
Think of a stock market index like a basket. Instead of apples or oranges, this basket holds shares of companies. The index then gives us a single number that represents the overall value of everything in that basket. The FTSE 100 is a particularly important basket, holding the shares of the 100 largest companies listed on the London Stock Exchange (LSE). When the index goes up, it generally means the value of the shares in that basket has increased. When it goes down, the value has decreased.
But there’s much more to the FTSE 100 than just a simple number. It’s a complex barometer influenced by global economics, political events, and the collective performance of some of the world’s most significant corporations. Let’s unpack what the FTSE meaning truly is and why it matters so much in the financial world.
The FTSE 100 Index is the flagship benchmark index for the UK equity market. Its full name is the Financial Times Stock Exchange 100 Index, a legacy from its original creators, the Financial Times and the London Stock Exchange. Today, it’s managed by FTSE Russell, a subsidiary of the London Stock Exchange Group (LSEG).
At its core, the FTSE 100 tracks the performance of the 100 UK-domiciled and international blue-chip companies listed on the LSE with the highest market capitalization. These aren’t just any companies; they are typically large, well-established, and often household names, representing a significant portion of the value traded on the London market.
- FTSE 100 includes the 100 largest companies on the LSE.
- The index is calculated using real-time data.
- The FTSE 100 serves as a global indicator of market health.
The index is calculated in real-time. Every second the London Stock Exchange is open, from its opening bell to its close, the FTSE 100 value is updated and published. This real-time calculation is crucial for traders and investors who need up-to-the-minute information to make decisions. Think of it like a constantly updating score for the UK’s top business league.
So, when you hear news anchors or financial reports talk about the ‘Footsie’s’ performance for the day, they are referring to the movement of this specific index. It serves as a vital indicator for investors globally who are looking at the UK as an investment destination.
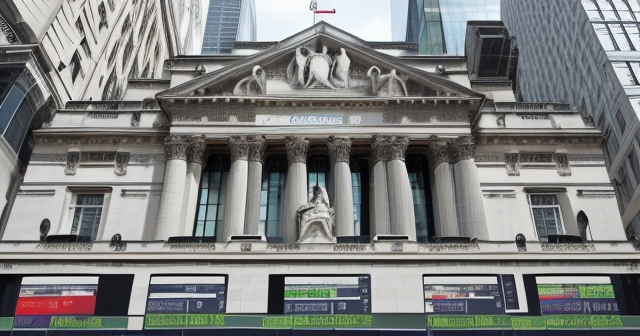
Where does the name “Footsie” come from? It’s simply a widely adopted, informal contraction of its full name, “Financial Times Stock Exchange Index”. This nickname is so common that it’s used regularly in financial news and conversation. You’ll also sometimes see it referred to by its Reuters instrument code, UKX. All these names point to the same entity: the index tracking the UK’s top 100 listed companies.
| Company | Market Capitalization (in billion GBP) | Sector |
|---|---|---|
| AstraZeneca | 172 | Healthcare |
| Shell | 180 | Energy |
| HSBC | 127 | Financials |
The operational side of the FTSE 100 is managed with precision by FTSE Russell. The index value is calculated using a specific formula based on the share prices of its constituent companies. The weighting of each company within the index is determined by its market capitalization, adjusted for shares that are freely available to public investors (known as the ‘free float’). This means that companies with a larger market value have a greater impact on the index’s movement than those with a smaller value.
The trading hours for the FTSE 100 directly correspond to the trading hours of the London Stock Exchange’s main market, which are typically from 08:00 to 16:30 UK time, Monday to Friday. During this period, every trade executed for a constituent company’s shares contributes to the real-time calculation of the index value. This constant activity means the index is a dynamic reflection of market sentiment and corporate performance throughout the trading day.
Understanding these mechanics is important because it explains why a significant price movement in a very large constituent company, like AstraZeneca or Shell, can have a much more pronounced effect on the FTSE 100’s overall value compared to a similar percentage move in a smaller company within the index.
The FTSE 100 didn’t appear out of nowhere. It was officially launched on 3 January 1984, replacing the older, less comprehensive FT 30 Index. The FT 30, created much earlier, only tracked a mere 30 companies, which became increasingly inadequate as the UK stock market grew and evolved.
The mid-1980s were a transformative period for the UK financial landscape. Margaret Thatcher’s government implemented sweeping financial deregulation, culminating in the momentous event known as the “Big Bang” in October 1986. This dramatically reformed the London Stock Exchange, removing fixed commissions, allowing foreign ownership of brokerage firms, and moving to electronic trading. The creation of the FTSE 100 happened just ahead of this revolution, providing a modern benchmark better suited to the changing market.
- The FTSE 100 launched on January 3, 1984.
- The index replaced the inadequate FT 30 Index.
- The Big Bang event led to significant market changes.
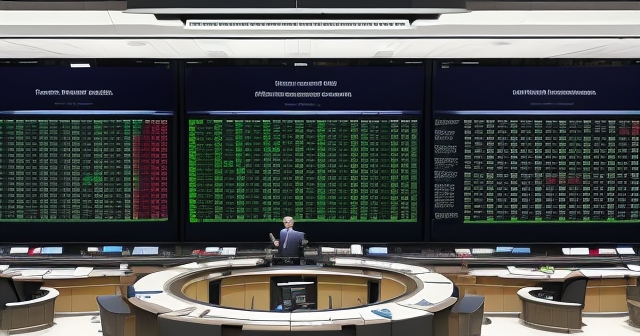
Alongside the Big Bang came a wave of major **privatisations**, as large state-owned enterprises were sold off to private investors. Giants like British Telecom (BT), British Gas, British Aerospace, and British Airways transitioned to public ownership, many eventually finding their way into the FTSE 100. These introductions significantly altered the composition and sector representation of the index over time.
The index has also lived through significant historical market events. Just a few years after its launch, it faced the global stock market crash of Black Monday in October 1987, experiencing one of its largest single-day percentage drops. Since then, it has navigated the dot-com bubble burst, the 2008 global financial crisis, the uncertainty surrounding Brexit, and the sharp but relatively short-lived downturn caused by the COVID-19 pandemic in 2020.
Each of these historical moments has shaped the FTSE 100, testing its resilience and reflecting the changing economic and corporate landscape. Understanding this history provides context for the index’s behavior today.
How does FTSE Russell actually calculate the value of the FTSE 100? The method used is called capitalization-weighting. This means that the weight, or influence, of each of the 100 companies in the index is proportional to its total market value.
The market value of a company is calculated simply by multiplying its current share price by the total number of its outstanding shares. For the index calculation, FTSE Russell uses the ‘free float’ market capitalization, which excludes shares held by insiders, governments, or other controlling entities that are unlikely to be traded on the open market. This gives a more accurate picture of the value available to public investors.
Here’s a simplified way to think about capitalization-weighting: Imagine the index as a pie chart where each company is a slice. The size of a company’s slice depends on its free-float market cap relative to the total free-float market cap of all 100 companies in the index. If a company makes up 10% of the total market cap, a 1% change in its share price will have roughly ten times the impact on the index value as a 1% change in a company that makes up only 1% of the total market cap.
This structure means that the performance of the very largest companies in the index—often referred to as mega-cap stocks—can heavily influence the overall movement of the FTSE 100. For example, if giants like AstraZeneca, Shell, or HSBC have a strong day, they can pull the entire index up even if some smaller constituents are performing poorly. Conversely, weakness in these heavyweights can drag the index down.
| Year | Event | Impact |
|---|---|---|
| 1984 | FTSE 100 launched | Modern market benchmark established |
| 1987 | Black Monday | Significant drop in index value |
| 2020 | COVID-19 pandemic | Market volatility and downturn |
The total market capitalization of the FTSE 100 is substantial, representing a vast pool of capital invested in these leading companies. Understanding this structure is key to interpreting why the index moves the way it does.
The 100 companies that make up the FTSE 100 aren’t set in stone forever. The index composition is reviewed and potentially adjusted on a quarterly basis by FTSE Russell. This process is crucial to ensure the index remains representative of the 100 largest eligible companies listed on the LSE by market capitalization.
These quarterly reviews typically happen in March, June, September, and December. FTSE Russell uses specific rules to determine which companies should be added to or removed from the index. Generally, companies ranking above 90 by full market capitalization will be added if they meet other eligibility criteria, while companies ranking below 110 will be removed. Companies ranking between 91 and 109 are typically kept in or out depending on their current status.
This means the index composition can change. Companies that have grown significantly in value may be promoted from the FTSE 250 (the index for the next 250 largest companies) into the FTSE 100. Conversely, companies whose market value has fallen relative to others may be demoted from the FTSE 100 to the FTSE 250. This process of promotion and demotion ensures the index stays true to its definition as tracking the top 100 by size.
The list of constituents includes a diverse range of sectors, although historically it has had significant exposure to financials, energy, basic materials, and consumer staples. This sector mix is important because different sectors are affected differently by economic conditions. For example, energy companies are highly sensitive to oil and gas prices, while consumer staples companies might be more resilient during economic downturns.
Staying aware of the major constituents and potential changes during the quarterly reviews can give you insight into the index’s sector biases and potential future movements based on industry trends.
Here’s a point that often surprises newcomers: despite being the UK’s benchmark index, the FTSE 100 is not always the best indicator of the health of the *domestic* UK economy. Why is this the case?
- The index includes many companies with international revenue streams.
- Exchange rates significantly affect valuations reported in GBP.
- FTSE 250 may better reflect domestic economic conditions.
The primary reason is the significant international exposure of the companies within the index. A large proportion of the revenue and profits generated by FTSE 100 companies comes from outside the United Kingdom. Many are truly global corporations with operations and sales across Europe, North America, Asia, and beyond. Their performance is often more tied to the health of the global economy than specifically the UK economy.
This global focus also makes the FTSE 100 highly sensitive to exchange rates, particularly the value of the pound sterling (GBP). When the pound weakens against other currencies (like the US Dollar or Euro), the overseas earnings of FTSE 100 companies are worth more when converted back into sterling. This can boost their reported profits and potentially their share prices, pushing the index up. Conversely, a stronger pound can have the opposite effect, making overseas earnings less valuable in sterling terms, which can put downward pressure on the index.
Consider this: a company based in the UK makes a substantial portion of its sales in the United States. If the pound weakens against the dollar, every dollar of profit earned in the US translates into more pounds when the company reports its results. This isn’t necessarily because the company is performing better in the US, but purely due to the currency conversion.
Because of this dynamic, an index like the FTSE 250 Index, which tracks the next 250 largest companies *primarily* focused on the UK domestic market, is often considered a more accurate reflection of the UK’s internal economic conditions. The FTSE 100, while important, is arguably more of a barometer for the UK’s position within the global economy and the performance of its major international players.
As we’ve seen, the FTSE 100 is not an isolated entity. Its movements are profoundly influenced by broader macroeconomic conditions and government policies, both in the UK and globally.
Global economic sentiment plays a massive role. Fears of a global recession, for instance, can significantly impact investor confidence. When economists poll and find a high chance of a global downturn, this can lead to risk aversion, causing investors to sell stocks and move into safer assets. Given the international nature of FTSE 100 companies, they are particularly susceptible to these global growth concerns.
International trade policies are another major factor. We’ve seen how significant policy changes, like announcements regarding widespread tariffs by major economies, can create volatility. The possibility of trade wars can disrupt supply chains, impact corporate profits, and trigger sharp reactions in global markets, including the FTSE 100. Conversely, easing trade tensions can lead to market rallies as uncertainty decreases.
Furthermore, macroeconomic data releases from around the world can move the index. Data points like consumer confidence surveys (even from countries like the US, given the global nature of FTSE 100 constituents’ sales), manufacturing indices, inflation rates, and employment figures all provide clues about the health of the global economy and can influence investor sentiment towards risk assets like stocks.
Central bank policies, particularly decisions on interest rates by the Bank of England, the US Federal Reserve, and the European Central Bank, also have a direct impact. Higher interest rates can increase borrowing costs for companies, potentially slowing growth, and can also make bonds and savings accounts relatively more attractive compared to stocks. Lower interest rates generally have the opposite effect.
Even specific events like significant **delistings** from the London Stock Exchange can matter. If a noticeable number of companies choose to delist, potentially seeking higher valuations or cheaper costs elsewhere (like the NYSE, as seen in 2024), it could reduce the pool of potential FTSE 100 companies over time and potentially impact the LSE’s standing as a global financial center. While not directly moving the index value day-to-day like macro news, it’s a longer-term structural trend worth noting.
FTSE Russell doesn’t just manage the FTSE 100. They maintain a comprehensive family of indices designed to cover different segments of the UK market and specific investment strategies. Understanding these related indices provides a fuller picture of the UK equity landscape.
The most commonly discussed sibling index is the FTSE 250 Index. As mentioned, this index tracks the next 250 largest companies listed on the LSE by market capitalization, following the top 100 in the FTSE 100. These are considered **mid-cap** companies. As they often have a greater focus on the UK domestic economy, the FTSE 250 can sometimes be a better barometer of the UK’s internal economic health than the FTSE 100.
Combining these two, you get the FTSE 350 Index, which simply comprises all the constituents of the FTSE 100 and the FTSE 250. This represents the large and mid-cap segments of the UK market together.
Going further down the market cap scale, there is the FTSE SmallCap Index, which tracks companies smaller than those in the FTSE 250. And even smaller still is the FTSE Fledgling Index.
The most comprehensive index in this family is the FTSE All-Share Index. This index combines the FTSE 100, FTSE 250, and FTSE SmallCap indices, effectively capturing around 98% of the UK’s eligible equity market capitalization. It provides the broadest view of the overall performance of UK-listed companies.
FTSE Russell also offers a range of specialised indices, such as those focusing on specific investment factors (like value or growth), sector-specific indices, and increasingly, indices focused on ESG (Environmental, Social, Governance) factors and **Sustainable Investment** criteria. These indices allow investors to track or invest in segments of the market that align with particular strategies or values.
While the FTSE 100 gets the most headlines, being aware of these other indices helps you understand the depth and breadth of the UK equity market and provides alternative benchmarks depending on your focus.
You might be wondering, “Can I invest directly in the FTSE 100 Index?” The answer is no, you cannot directly buy the index itself. It is simply a number representing the aggregate value of its constituents. However, you can gain exposure to the performance of the FTSE 100 through various financial products designed to track or replicate its movements.
- Exchange Traded Funds (ETFs) mimicking FTSE 100 composition.
- Index funds that follow the same structure.
- Derivatives like futures contracts and options based on the index.
The most common way for investors to gain exposure is through **Exchange Traded Funds (ETFs)** and **index funds**. These are types of investment funds that hold a portfolio of stocks designed to mimic the composition and weighting of the FTSE 100. When you buy shares in a FTSE 100 ETF or index fund, you are indirectly investing in all 100 constituent companies in proportion to their weighting in the index. As the index value goes up or down, the value of your ETF or fund shares typically follows.
ETFs are particularly popular because they trade on stock exchanges just like regular shares, offering liquidity and flexibility. Index funds, while similar, are typically bought and sold directly with the fund provider. Both offer a relatively low-cost way to achieve broad diversification across the UK’s largest companies without having to buy each stock individually.
Another way to gain exposure, particularly for traders, is through **derivatives**. This includes products like **futures contracts** and **options contracts** based on the FTSE 100. These are more complex instruments that allow you to speculate on the future direction of the index value without owning the underlying stocks. They are often used by experienced traders for hedging or speculation and involve significant risk.
Furthermore, some trading platforms offer **Contracts for Difference (CFDs)** based on the FTSE 100 index. CFDs allow you to trade on the price difference of the index from the time you open a contract to the time you close it, without owning the underlying asset. CFDs are leveraged products, meaning you can control a large position with a relatively small amount of capital, but this also magnifies potential profits and losses.
If you’re exploring different trading opportunities, perhaps including index CFDs or even foreign exchange (forex) pairs involving the pound sterling, choosing a suitable trading platform is a key step. Moneta Markets is an Australian-based platform that is worth considering. They offer a wide range of financial instruments, potentially including index CFDs and forex, suitable for both beginners and experienced traders.
The performance of the FTSE 100 is a constantly evolving story, shaped by the flow of daily news, economic data, and shifts in investor sentiment. Looking at recent trends can give us insight into the current forces at play.
- Recent rallies linked to improvements in international trade relations.
- Market pullbacks connected to fears of global recession.
- Company-specific news affecting individual stock performance.
As we discussed, the index is highly sensitive to global factors. For example, recent periods have shown rallies influenced by perceived improvements in international trade relations or shifts in central bank outlooks. Conversely, specific negative macroeconomic forecasts, like concerns about a potential global recession, can trigger pullbacks as investors become more cautious.
Individual company news also matters. Strong earnings reports from heavyweight constituents can provide a boost, while unexpected poor performance or scandal at a major company can weigh on the index. Broker notes, which are analysts’ recommendations on specific stocks, can also influence share prices and, in turn, the index.
A notable trend observed recently, as highlighted in the data, is the increasing number of **delistings** from the London Stock Exchange in 2024, reaching levels not seen since the 2007-2008 financial crisis. Companies citing reasons like higher valuations or cheaper costs on other exchanges, particularly the NYSE, is a trend that market participants are watching closely. While this doesn’t directly impact the *current* FTSE 100 value as much as macroeconomic news, it speaks to the competitiveness of the London market and could affect the future pool of large UK-listed companies.
Remember that market movements are often a complex interplay of many factors. A day with an impressive rally, perhaps spurred by positive international news, might still see some individual constituents decline due to company-specific issues. Likewise, negative global sentiment might overshadow positive domestic UK data.
Following financial news sources that provide analysis of these daily and weekly trends is crucial for anyone trying to understand the current market dynamics impacting the Footsie.
For both investors and traders, the FTSE 100 serves multiple purposes in analysis and strategy development. As a beginner investor, understanding its movements helps you gauge the performance of the broader UK stock market where you might invest in individual shares or funds.
For those interested in technical analysis, the FTSE 100 index chart is a popular tool. Traders look for patterns, trends, support, and resistance levels on the index chart itself to forecast potential future movements. They might use indicators like moving averages, MACD, or RSI, applying them to the index just as they would to an individual stock. Analyzing the index’s price action can provide clues about overall market sentiment and momentum.
Fundamental analysis applied to the FTSE 100 involves looking at the collective health of the 100 constituent companies, their aggregated earnings, dividends, and valuations (like the overall price-to-earnings ratio of the index). It also involves macro-level analysis – assessing the impact of economic growth forecasts, inflation, interest rates, and political stability on the index’s prospects.
Different investment and trading strategies can be built around the FTSE 100. A long-term investor might use an index fund or ETF as a core holding to get diversified exposure to large-cap UK companies. A short-term trader might use index CFDs or futures to speculate on daily or weekly price swings. Some might even use options to hedge existing portfolios or implement more complex trading strategies.
Your chosen approach will depend on your investment goals, risk tolerance, and time horizon. Regardless of your specific strategy, having a solid understanding of what the FTSE 100 represents, how it’s calculated, and what influences its value is a fundamental building block for navigating the UK stock market.
If you are considering exploring trading opportunities, such as those offered by index CFDs or foreign exchange markets, selecting a platform that meets your needs is important. Moneta Markets supports popular trading platforms like MT4, MT5, and Pro Trader, offering flexibility and technological advantages like high-speed execution and competitive spreads, which are valuable features for active traders.
Conclusion: Synthesizing FTSE 100 Knowledge for Investors
We’ve covered a lot of ground in understanding the FTSE 100 Index. From its identity as the UK’s premier benchmark of the top 100 listed companies by market capitalization to its historical evolution shaped by deregulation and privatisations, the Footsie is more than just a number—it’s a vital reflection of a significant part of the global financial landscape.
We’ve seen how its capitalization-weighted structure gives greater influence to the largest companies and how its significant international exposure means its movements are often more closely tied to global economics and currency fluctuations than to the UK’s domestic health alone. Understanding these nuances, including the role of related indices like the FTSE 250, helps paint a clearer picture.
Macroeconomic forces, international policies, and even specific company performance all play a role in driving the index’s value. For investors and traders, gaining exposure is typically done through tracking products like ETFs and index funds, or for more active strategies, via derivatives and CFDs.
Mastering the basics of the FTSE 100—what it is, how it works, and what factors influence it—provides you with a fundamental tool for analyzing the UK market. Whether you use it as a benchmark for long-term investing or as the basis for short-term trading decisions, the knowledge you’ve gained here is a valuable asset on your financial journey.
As you continue to explore the markets, remember that continuous learning and adaptation are key. The financial world is always moving, and staying informed about the major indices and the forces that shape them is crucial for navigating its complexities successfully.
ftse meaningFAQ
Q:What does FTSE stand for?
A:FTSE stands for Financial Times Stock Exchange.
Q:How is the FTSE 100 calculated?
A:The FTSE 100 is calculated based on market capitalization and is updated in real-time during trading hours.
Q:Why is the FTSE 100 important?
A:The FTSE 100 serves as a barometer for the UK’s economy and reflects the performance of its largest companies.
“`
You may also like
Calendar
| 一 | 二 | 三 | 四 | 五 | 六 | 日 |
|---|---|---|---|---|---|---|
| 1 | 2 | 3 | 4 | 5 | 6 | 7 |
| 8 | 9 | 10 | 11 | 12 | 13 | 14 |
| 15 | 16 | 17 | 18 | 19 | 20 | 21 |
| 22 | 23 | 24 | 25 | 26 | 27 | 28 |
| 29 | 30 | 31 | ||||
發佈留言
很抱歉,必須登入網站才能發佈留言。