
Forex Pivot Points: Unlock 7 Key Levels for Smarter Trades Today
Introduction to Forex Pivot Points: Your Foundation for Technical Analysis
Pivot points have long served as a cornerstone in the toolkit of technical traders, especially within the fast-moving world of forex. These levels are derived from the previous trading session’s high, low, and closing prices, offering a forward-looking method to anticipate where price might find support or resistance during the current session. Originally employed by floor traders on exchange floors to identify potential turning points, pivot points have evolved into a widely adopted analytical tool in digital trading environments. Their enduring relevance stems from their simplicity and predictive power—by highlighting zones where market participants are likely to react, they help traders structure their decisions around objective, data-driven levels. Whether used for scalping, day trading, or swing strategies, pivot points provide a reliable framework for interpreting intraday dynamics.
Why Pivot Points Are Indispensable for Forex Traders
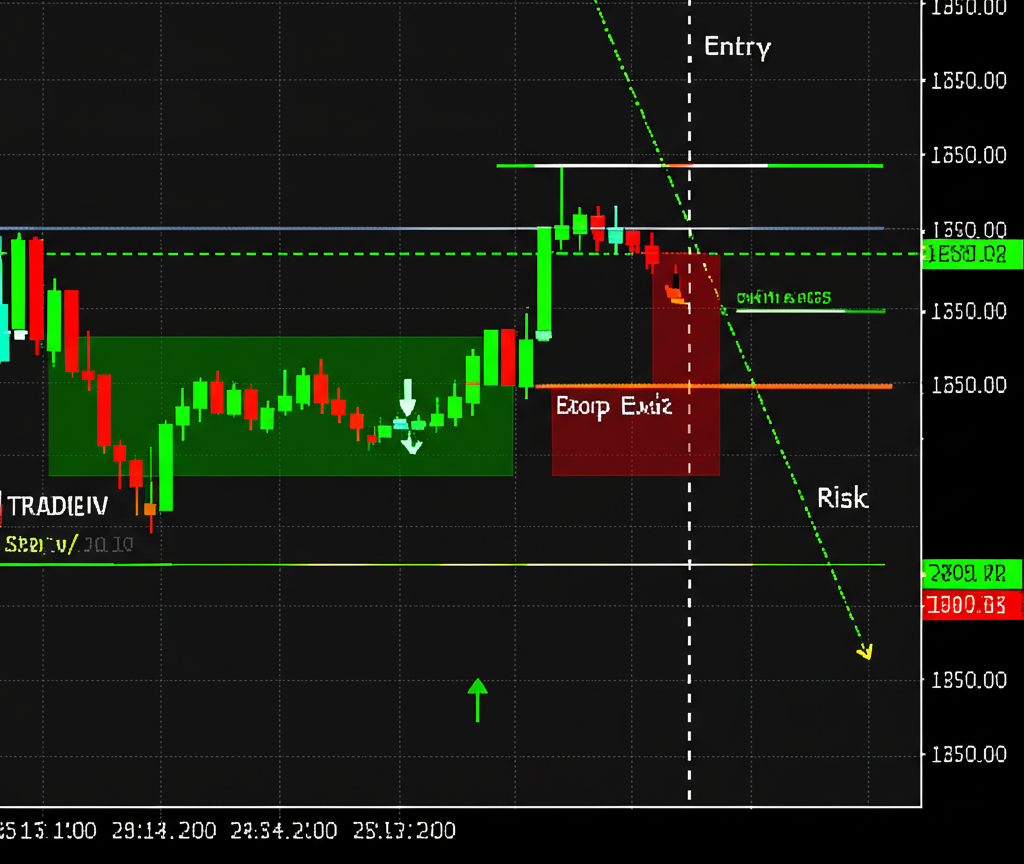
What makes pivot points so valuable is their ability to bring clarity to complex price action. They offer a structured, rule-based system for identifying high-probability trade zones without relying on subjective interpretation. One of their primary functions is to pinpoint potential reversal or breakout areas—key thresholds where price may stall, reverse, or accelerate. This makes them ideal for determining precise entry and exit points. Moreover, pivot levels naturally lend themselves to risk management. Traders can place stop-loss orders just beyond support or resistance levels, aligning their risk parameters with actual market structure rather than arbitrary price points.
Beyond trade execution, pivot points also reflect broader market sentiment. When price holds above the central pivot point (PP), it typically indicates bullish momentum, suggesting buyers are in control. Conversely, sustained trading below PP often signals bearish dominance. Because of this dual role—both tactical and psychological—pivot points are versatile across trading styles. Intraday traders use them to time entries, while swing traders incorporate them into broader trend assessments. Their universal applicability across timeframes and instruments further solidifies their status as an essential analytical component.
Understanding the Anatomy: Pivot Levels and Their Significance
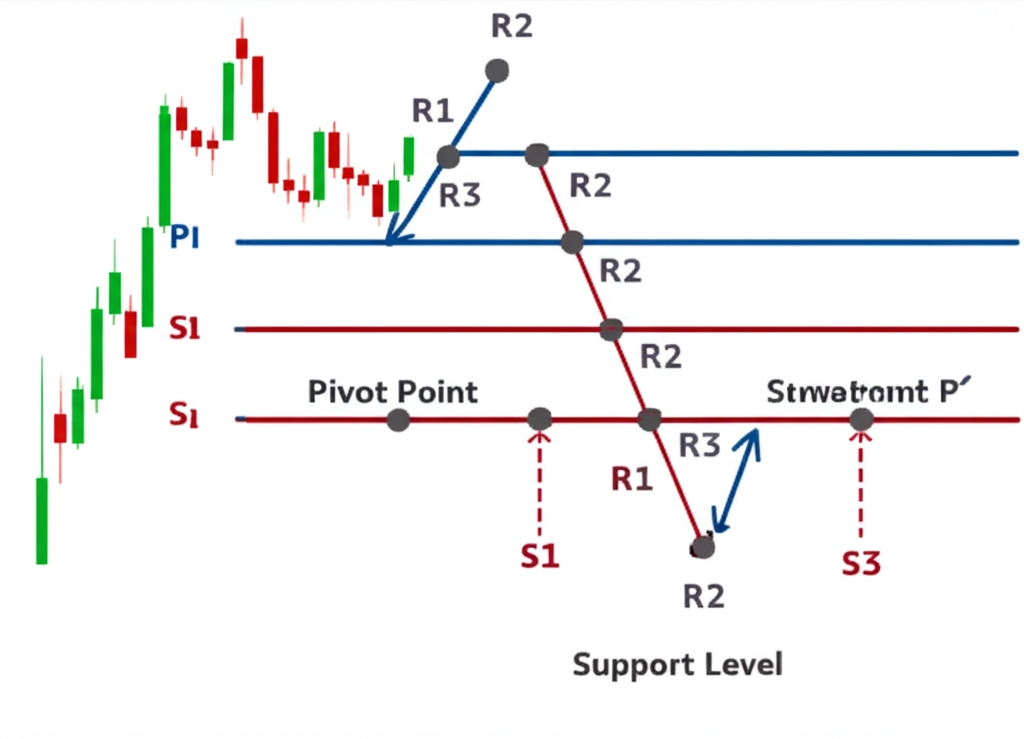
At the heart of pivot analysis lies a structured hierarchy of levels anchored around a central pivot point. This central level, known as PP, serves as the baseline for the day’s expected price activity. From PP, three tiers of resistance (R1, R2, R3) extend upward, while three corresponding support levels (S1, S2, S3) stretch downward. These levels are calculated using standardized formulas based on the prior period’s price data, creating a symmetrical grid that maps potential reaction zones.
Each level carries distinct implications. R1 and S1 represent the first lines of defense in the prevailing range. If price approaches R1 and fails to break through, it may retreat toward PP or even S1—this kind of rejection often forms the basis for reversal trades. On the other hand, a confirmed break above R1 can signal increasing bullish momentum, potentially opening the path toward R2 and R3. Similarly, a drop below S1 might indicate bearish acceleration, with S2 and S3 acting as subsequent targets.
The spacing between these levels provides insight into market volatility and directional strength. In tightly ranged markets, price may oscillate between PP and R1/S1, offering opportunities for range-bound strategies. In trending conditions, however, price may rapidly move through multiple levels, turning former resistance into support (or vice versa). Understanding how price interacts with each tier allows traders to adapt their approach dynamically—whether fading reversals, riding breakouts, or waiting for consolidation.
How to Calculate Forex Pivot Points (Formulas & Tools)
While modern trading platforms often generate pivot levels automatically, understanding the underlying calculations enhances a trader’s ability to interpret and apply them effectively. The most widely used method is the standard pivot point calculation, which averages the previous period’s high, low, and close to determine the central pivot point.
Standard Pivot Point Calculation Explained
The foundation of the standard method is straightforward arithmetic. The central pivot point (PP) is calculated first, followed by sequential derivation of support and resistance levels.
**Core Formulas:**
– **Pivot Point (PP)** = (High + Low + Close) ÷ 3
– **First Resistance (R1)** = (2 × PP) – Low
– **First Support (S1)** = (2 × PP) – High
– **Second Resistance (R2)** = PP + (High – Low)
– **Second Support (S2)** = PP – (High – Low)
– **Third Resistance (R3)** = R1 + (High – Low)
– **Third Support (S3)** = S1 – (High – Low)
**Practical Example:**
Let’s assume the previous day’s data for EUR/USD was:
– High: 1.1050
– Low: 1.0950
– Close: 1.1020
Calculations:
– **PP** = (1.1050 + 1.0950 + 1.1020) ÷ 3 = **1.1006**
– **R1** = (2 × 1.1006) – 1.0950 = **1.1062**
– **S1** = (2 × 1.1006) – 1.1050 = **1.0962**
– **R2** = 1.1006 + (1.1050 – 1.0950) = **1.1106**
– **S2** = 1.1006 – (1.1050 – 1.0950) = **1.0906**
– **R3** = 1.1062 + 0.0100 = **1.1162**
– **S3** = 1.0962 – 0.0100 = **1.0862**
These values are then plotted on the current day’s chart, forming a predictive grid that guides trading decisions throughout the session.
Leveraging a Forex Pivot Point Calculator for Efficiency
Although manual computation builds foundational knowledge, relying on a dedicated **Forex pivot points calculator** is far more practical in live trading. These tools—available through broker platforms, financial websites like Investing.com or DailyFX, or standalone apps—automate the entire process. By inputting just the prior period’s high, low, and close, traders instantly receive all pivot levels across multiple types (Standard, Woodie, Camarilla, Fibonacci).
This not only saves time but also reduces the risk of calculation errors, especially when managing multiple currency pairs. Many calculators allow customization by timeframe—daily, weekly, or monthly—making them adaptable to different trading styles. For instance, a day trader might focus on daily pivot points to guide intraday decisions, while a position trader could analyze weekly levels for broader context. With real-time updates and visual chart integration, these tools turn complex data into actionable insights at a glance.
Exploring Different Types of Pivot Points and Their Best Use Cases
While the standard method remains popular, alternative pivot point calculations offer nuanced advantages depending on market behavior and trading objectives. Each variant adjusts the weighting of price inputs or applies different mathematical models, resulting in variations in level placement and responsiveness.
Woodie Pivot Points: Focusing on Recent Price Action
Woodie pivot points place greater emphasis on the closing price, assuming it carries more significance than the high or low. This makes them more reactive to recent market sentiment, particularly useful for short-term traders.
**Formulas:**
– **PP** = (High + Low + 2 × Close) ÷ 4
– **R1** = (2 × PP) – Low
– **S1** = (2 × PP) – High
– **R2** = PP + (High – Low)
– **S2** = PP – (High – Low)
– **R3** = R1 + (High – Low)
– **S3** = S1 – (High – Low)
Because the closing price has double weight, Woodie pivots shift more quickly in response to strong closeouts, making them favored among scalpers and intraday traders who prioritize recency over symmetry.
Camarilla Pivot Points: Precision for Range Trading
Camarilla pivots are designed for high-precision trading in range-bound environments. They generate eight levels (four support and four resistance) that are much closer to the current price, reflecting the idea that markets often revert to the mean after small excursions.
**Key Formulas (based on Range = High – Low):**
– **R1** = Close + (Range × 1.1 ÷ 12)
– **R2** = Close + (Range × 1.1 ÷ 6)
– **R3** = Close + (Range × 1.1 ÷ 4)
– **R4** = Close + (Range × 1.1 ÷ 2)
– **S1** = Close – (Range × 1.1 ÷ 12)
– **S2** = Close – (Range × 1.1 ÷ 6)
– **S3** = Close – (Range × 1.1 ÷ 4)
– **S4** = Close – (Range × 1.1 ÷ 2)
These tight clusters make Camarilla levels excellent for identifying overextended moves and setting up “fade” trades—entering against the short-term move when price hits R3/R4 or S3/S4. They’re especially effective during low-volatility sessions or Asian market hours when trends are less defined.
Fibonacci Pivot Points: Integrating Natural Ratios
Fibonacci pivot points blend classical pivot calculations with Fibonacci retracement ratios—38.2%, 50%, and 61.8%—which are believed to represent natural market harmonics. This hybrid approach appeals to traders who view markets through the lens of proportional retracements.
**Formulas:**
– **PP** = (High + Low + Close) ÷ 3
– **R1** = PP + (Range × 0.382)
– **R2** = PP + (Range × 0.618)
– **R3** = PP + (Range × 1.000)
– **S1** = PP – (Range × 0.382)
– **S2** = PP – (Range × 0.618)
– **S3** = PP – (Range × 1.000)
By aligning pivot levels with well-known Fibonacci zones, this method enhances their psychological significance. Traders often use Fibonacci pivots to set profit targets or identify deep retracements within a larger trend.
Comparing Pivot Point Types: Which One Suits Your Strategy?
Selecting the right pivot point type depends on your trading style, timeframe, and the prevailing market environment. The table below summarizes key characteristics to help guide your choice.
| Pivot Point Type | Calculation Emphasis | Ideal Market Conditions | Best For | Pros | Cons |
| :————— | :——————- | :———————- | :——- | :— | :— |
| **Standard** | Average of H, L, C | Trending or Ranging | General use, long/short term | Widely accepted, balanced | Can be less precise in highly volatile markets |
| **Woodie** | Close price | Short-term, volatile | Intraday trading, quick reversals | Reactive to recent price, good for scalping | Levels can be very close, more false signals |
| **Camarilla** | Close price, Range coefficients | Range-bound, tight reversals | Short-term reversals, range trading | Highly precise entry/exit, good for fading | Less effective in strong trends, levels very close |
| **Fibonacci** | Standard PP, Fibonacci ratios | Retracements, extensions, trending | Swing trading, identifying deeper moves | Integrates natural ratios, strong psychological levels | Can be subjective, less relevant in choppy markets |
This **Forex pivot points table** underscores a critical point: no single method dominates. Success comes from matching the tool to the context, not searching for a universal solution.
Advanced Forex Pivot Point Trading Strategies
Using pivot points effectively goes beyond simply drawing lines on a chart. The real edge lies in interpreting how price behaves at these levels and integrating them into a comprehensive strategy that includes confirmation, timing, and risk control.
Trading Breakouts with Pivot Points: Capturing Momentum
Breakout trading involves entering when price moves decisively beyond a key pivot level, signaling potential continuation. For example, if EUR/USD breaks above R1 with strong bullish momentum and closes firmly above it, this could indicate the start of an upward move toward R2. Traders often wait for a full candlestick closure beyond the level to confirm the breakout, reducing false signals.
Position sizing and stop placement are crucial. A stop-loss is typically placed just below R1 (for long entries) to invalidate the trade if price reverses sharply. Take-profit targets are often set at the next pivot level—R2 or R3—though trailing stops can be used in strong trends. This approach works best in trending markets or after periods of consolidation.
Trading Reversals and Bounces: Profiting from Price Action at Key Levels
Reversal strategies capitalize on price rejection at pivot zones. If gold approaches R2 and forms a bearish engulfing pattern or a pin bar, it may signal exhaustion and a potential drop toward PP or S1. Similarly, a bullish rejection at S1—especially with oversold RSI readings—can present a high-probability long opportunity.
Confirmation is key. A lone touch of a pivot level isn’t enough. Traders should look for confluence: candlestick patterns, momentum divergence (e.g., MACD showing lower highs while price makes higher highs), or volume spikes. The stronger the confirmation, the higher the likelihood of a successful reversal trade.
Range Trading and Consolidation Strategies Using Pivot Points
In sideways markets, pivot points help define the boundaries of consolidation. Price often gravitates toward the central PP, acting as a magnet, while R1 and S1 serve as upper and lower rails. Traders can exploit this behavior by buying near S1 with a target at PP or R1, and selling near R1 with a target at PP or S1.
This strategy thrives in low-volatility environments—such as during holiday seasons or between major news releases. Camarilla pivots, with their tighter levels, are particularly effective here, allowing for finer entries and exits. However, traders must remain alert for breakout signals that could invalidate the range.
Combining Pivot Points with Other Indicators for Stronger Signals
To increase signal reliability, pivot points should be used in conjunction with other technical tools:
– **Moving Averages:** A 50-period MA aligning with S1 adds weight to the support level. A bounce off both the MA and S1 increases confidence.
– **RSI or Stochastic Oscillator:** Overbought readings at R2 or oversold conditions at S2 can foreshadow reversals.
– **MACD:** Bullish or bearish divergence at a pivot level can signal weakening momentum.
– **Bollinger Bands:** Price touching the upper band near R1 may indicate overextension, reinforcing a reversal setup.
This layered approach filters noise and increases the probability of successful trades by requiring multiple forms of validation.
Real-World Application: Trading Specific Instruments with Pivot Points
Different financial instruments exhibit unique price behaviors, and pivot points must be adapted accordingly. Understanding the nuances of volatility, liquidity, and catalyst sensitivity improves their effectiveness.
Trading Gold (XAUUSD) with Pivot Points: Special Considerations
Gold (XAUUSD) is renowned for its sensitivity to geopolitical tensions, inflation data, and central bank policies. Its price often moves in strong, sustained trends, making pivot points particularly useful for identifying continuation or exhaustion points.
When analyzing **XAUUSD pivot points**, traders should pay close attention to R2, R3, S2, and S3—these higher-tier levels frequently act as targets during strong moves. A breakout above R2 on high volume, for example, may signal the beginning of a bullish surge. Conversely, a breakdown below S2 could precede a sharp sell-off. Due to gold’s momentum-driven nature, false breakouts are less common, but confirmation with volume or momentum indicators remains prudent. Many traders search for “Gold pivot points today” to align their intraday strategy with current levels.
GBPUSD Pivot Point Strategies: Navigating Major Pair Volatility
The GBPUSD pair is among the most volatile major currencies, often reacting sharply to UK economic data, BoE announcements, and political developments. When applying **GBPUSD pivot points**, traders must account for this volatility.
The central pivot point (PP) often acts as a psychological battleground. A sustained trade above PP suggests bullish control, while failure to hold above it can trigger bearish follow-through. Breakouts from R1 or S1 are common, but they require tight risk management due to the pair’s tendency for whipsaws. Reversal strategies work well during consolidation phases, especially when supported by candlestick patterns or RSI divergence. Given its liquidity, GBPUSD responds predictably to pivot levels—provided traders respect the broader context.
Daily Pivot Points in Action: Intraday Trading Focus
**Daily pivot points**
發佈留言
很抱歉,必須登入網站才能發佈留言。