Pivot Points Forex: Unlock New Trading Opportunities with 5 Powerful Methods
Introduction to Pivot Points in Forex
Navigating the fast-moving world of Forex trading demands tools that offer clarity amid volatility. Among the most time-tested and effective is the pivot point—a technical indicator that helps traders forecast potential turning points in price action. By calculating key support and resistance levels based on prior session data, pivot points serve as a compass for anticipating market behavior. Whether you’re just starting out or refining an advanced strategy, understanding how to apply pivot points can significantly improve your timing, risk control, and overall trading edge.
Understanding the Anatomy of Pivot Points
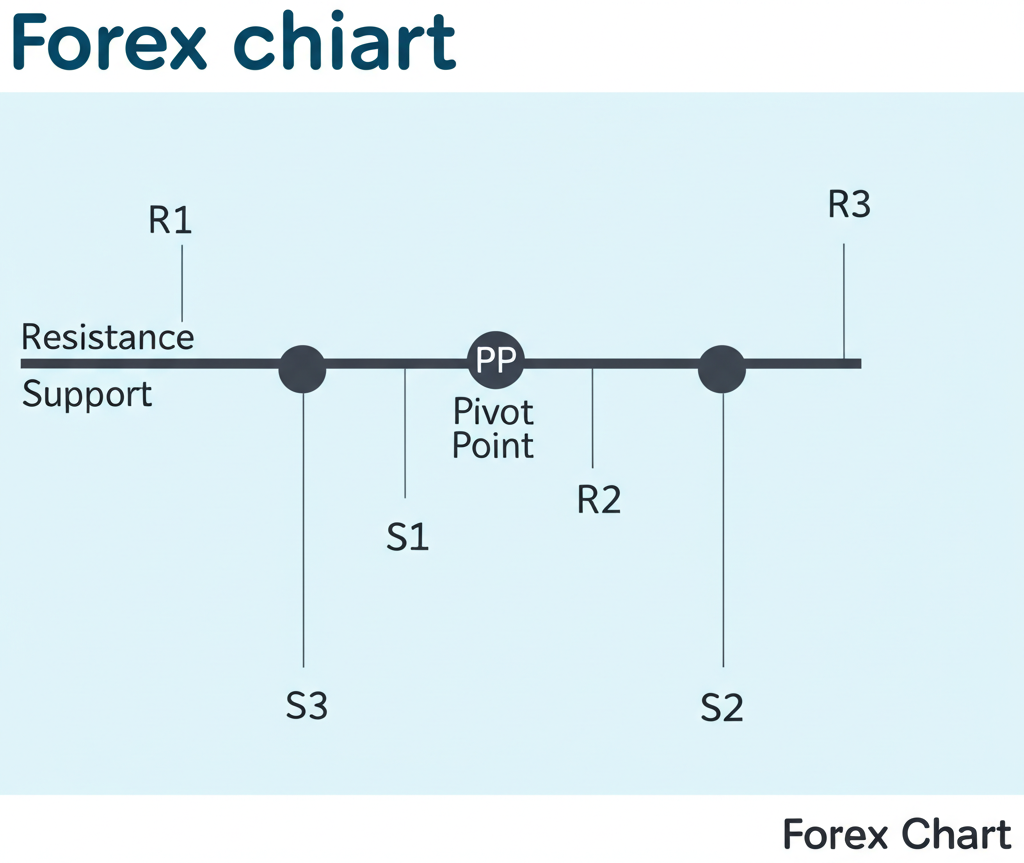
At the heart of pivot point analysis lies a structured framework of price levels derived from previous market activity. The central Pivot Point (PP) acts as a psychological midpoint, reflecting the balance between buyers and sellers. From this fulcrum, multiple layers of support and resistance extend outward—labeled S1, S2, S3 below the PP, and R1, R2, R3 above it. These levels aren’t arbitrary; they represent zones where institutional and retail traders alike often position orders, making them magnet points for price reactions.
- Pivot Point (PP): This level functions as a benchmark. Price trading above the PP suggests bullish momentum, while movement below signals bearish pressure. It often becomes a battleground during retracements, especially when tested after a breakout.
- Resistance Levels (R1, R2, R3): These are potential ceilings where selling interest may increase. R1 is typically the first line of defense in an uptrend. If breached, R2 and R3 become relevant targets. Strong trends may push through R1 and R2, but R3 often marks an overextended zone.
- Support Levels (S1, S2, S3): On the flip side, these act as floors where buying interest could emerge. S1 is the immediate safety net in a downtrend. A break below S1 often signals further downside, with S2 and S3 serving as subsequent targets.
It’s important to remember that these levels are not impenetrable walls but rather areas of increased market attention. Their strength grows when they align with other technical signals—such as trendlines, moving averages, or Fibonacci retracements—creating what traders call confluence, which increases the reliability of potential reversals or continuations.
How to Calculate Pivot Points: Methods & Formulas
While the core concept of pivot points remains consistent—deriving key levels from past price data—different calculation methods offer unique insights depending on trading style and market context. Each method uses the prior period’s high, low, and close, but assigns varying weight to these values. Choosing the right one depends on your timeframe, volatility tolerance, and strategic goals.
The Classic (Floor) Pivot Point Calculation
Originating from traditional trading floors, the Classic method remains the most widely used due to its simplicity and broad applicability. It treats the high, low, and close equally, making it a balanced representation of prior session sentiment.
- Pivot Point (PP): (High + Low + Close) / 3
- First Resistance (R1): (2 × PP) – Low
- First Support (S1): (2 × PP) – High
- Second Resistance (R2): PP + (High – Low)
- Second Support (S2): PP – (High – Low)
- Third Resistance (R3): High + 2 × (PP – Low)
- Third Support (S3): Low – 2 × (High – PP)
For intraday traders, the previous day’s data is typically used. Swing traders may opt for weekly highs, lows, and closes to generate broader reference points. Because of its balanced design, the Classic method works well across various market conditions and is especially useful for beginners learning to identify structure.
Fibonacci Pivot Points
This variation blends traditional pivot calculations with Fibonacci ratios—0.382, 0.618, and 1.000—levels that frequently appear in market retracements. The idea is that price doesn’t just react to arbitrary levels but tends to pause or reverse at mathematically significant points.
- Pivot Point (PP): (High + Low + Close) / 3
- Resistance Levels:
- R1: PP + ((High – Low) × 0.382)
- R2: PP + ((High – Low) × 0.618)
- R3: PP + ((High – Low) × 1.000)
- Support Levels:
- S1: PP – ((High – Low) × 0.382)
- S2: PP – ((High – Low) × 0.618)
- S3: PP – ((High – Low) × 1.000)
Traders who already use Fibonacci tools in their analysis often find this method intuitive. The resulting levels tend to align with natural price rhythms, making them particularly effective in trending or moderately volatile markets.
Woodie Pivot Points
Woodie pivots place greater emphasis on the closing price, assuming it carries more weight than the high or low in determining market sentiment. This makes the method more responsive to recent price action, which can be advantageous in fast-moving sessions.
- Pivot Point (PP): (High + Low + (2 × Close)) / 4
- First Resistance (R1): (2 × PP) – Low
- First Support (S1): (2 × PP) – High
- Second Resistance (R2): PP + (High – Low)
- Second Support (S2): PP – (High – Low)
Note that R3 and S3 are often omitted in this method, as the focus is on immediate intraday structure. Because the close is doubled in the formula, Woodie pivots can shift noticeably from Classic levels, especially after strong closes. This makes them popular among day traders who prioritize recent momentum.
Camarilla Pivot Points
Designed for precision in short-term trading, Camarilla pivots generate eight tightly packed levels—four above and four below the close—making them ideal for scalpers and range traders. Unlike other methods, there’s no central PP; instead, the previous close serves as the anchor.
- Resistance Levels:
- R4: (Close – Low) × 1.1 / 2 + Close
- R3: (Close – Low) × 1.1 / 4 + Close
- R2: (Close – Low) × 1.1 / 6 + Close
- R1: (Close – Low) × 1.1 / 12 + Close
- Support Levels:
- S1: Close – (High – Close) × 1.1 / 12
- S2: Close – (High – Close) × 1.1 / 6
- S3: Close – (High – Close) × 1.1 / 4
- S4: Close – (High – Close) × 1.1 / 2
These levels are particularly effective in sideways or low-volatility markets, where price tends to oscillate between tight boundaries. Traders often use R3/S3 as reversal zones and R4/S4 as breakout targets. The method’s sensitivity makes it less suitable for strong trends but excellent for intraday range plays.
DeMark Pivot Points
DeMark (or TD) pivots take a unique approach by incorporating the relationship between the current close and the prior open. The calculation adjusts based on whether the market closed higher, lower, or flat, aiming to detect potential exhaustion points in a trend.
- First, calculate ‘X’:
- If Close < Open: X = High + (2 × Low) + Close
- If Close > Open: X = (2 × High) + Low + Close
- If Close = Open: X = High + Low + (2 × Close)
- Pivot Point (PP): X / 4
- First Resistance (R1): X / 2 – Low
- First Support (S1): X / 2 – High
This method is less common but offers a contrarian perspective. When a strong trend closes near its high or low, DeMark pivots may suggest overextension, signaling potential reversals. They’re especially useful during late-stage moves or after extended rallies or sell-offs.
Choosing the Right Calculation Method for Your Trading Style
Selecting the appropriate pivot method isn’t about finding the “best” one—it’s about matching the tool to your strategy. Each approach has strengths and weaknesses depending on market dynamics and trading horizon.
Technical analysis, which includes the use of pivot points, is a broad discipline, and selecting the right tools is paramount.
| Method | Primary Focus | Best For | Key Characteristic |
|---|---|---|---|
| Classic | Balanced support/resistance | All timeframes, general analysis | Equal weighting of High, Low, Close |
| Fibonacci | Psychological retracement levels | Swing trading, trend following | Integrates Fibonacci ratios |
| Woodie | Recent price action (Close) | Intraday trading, reactive signals | Heavier weighting on Close price |
| Camarilla | Tight, aggressive intraday levels | Scalping, short-term reversals | Close-range derived levels (R1-R4, S1-S4) |
| DeMark | Trend exhaustion, unique levels | Identifying potential turns, contrarian views | Conditional calculation based on Open/Close |
For newcomers, the Classic method provides a solid foundation. Intraday traders may prefer Woodie or Camarilla for their responsiveness, while swing traders often benefit from Fibonacci or weekly Classic pivots. The best approach is to test different methods across various currency pairs and timeframes to see which aligns best with your edge. Backtesting can reveal patterns in how specific pairs respect certain pivot types—some may favor Camarilla levels, while others consistently bounce off Fibonacci zones.
Interpreting Pivot Point Levels for Forex Trading
Calculating pivot points is just the beginning; their real value emerges in how you interpret price action around them. Skilled traders don’t just watch the levels—they analyze how the market reacts when price approaches, touches, or breaks through them.
Identifying Support and Resistance
The most direct application of pivot points is identifying potential support and resistance zones. When price approaches S1 and bounces, it confirms the level’s strength. Repeated tests of S2 or R2 that hold increase their significance. The PP itself often acts as a dynamic support or resistance—especially when it aligns with a moving average or previous swing point.
These levels gain credibility over time. For example, if EURUSD has bounced off S1 three times in the past week, traders will pay closer attention when it approaches again. The collective awareness of these levels among market participants creates self-fulfilling reactions—stops cluster around them, and institutions often place orders near these zones.
Gauging Market Sentiment and Trend Bias
Pivot points offer a quick snapshot of intraday sentiment. If price opens above the PP and stays there, the bias is bullish. A break above R1 reinforces that view. Conversely, if price opens below the PP and fails to reclaim it, the bearish case strengthens. A retest of the PP from below that results in rejection adds further downside confirmation.
This framework helps traders avoid counter-trend trades during strong momentum phases. For instance, trying to short at R1 during a rally that has already cleared R2 may be risky—especially if volume and momentum support the move. Instead, waiting for a pullback to R1 or PP with reversal signs offers a higher-probability setup.
Multi-Timeframe Pivot Point Analysis
One of the most powerful ways to use pivot points is by layering them across timeframes. Daily pivots guide intraday decisions, but their strength multiplies when they align with weekly or monthly levels.
- Daily Pivots: Ideal for intraday strategies, offering precise entry and exit zones on 1H or 15M charts.
- Weekly Pivots: Provide a broader context. A daily S1 that coincides with a weekly S1 becomes a high-conviction support area.
- Monthly Pivots: Represent major psychological levels. Institutional traders often monitor these, making them significant during macro shifts.
When multiple timeframes converge—say, the daily PP lines up with the weekly R1—it creates a high-impact zone. Price may slow down, reverse, or accelerate through with strong momentum. Either way, such confluence demands attention and often leads to high-impact moves. Traders can use this to filter out noise and focus on the most meaningful levels.
Effective Pivot Point Trading Strategies in Forex
Pivot points are more than reference lines—they’re the backbone of structured trading systems. When combined with price action and risk management, they form the basis of repeatable strategies.
Reversal (Bounce) Strategies
This strategy capitalizes on price rejecting a pivot level. It works best in range-bound or moderately trending markets where support and resistance are clearly defined.
Entry: Look for price to reach S1 or R1 and show reversal signs—such as a bullish engulfing pattern at S1 or a bearish pin bar at R1. Oscillators like RSI or Stochastic can add confirmation, especially if they show overbought or oversold conditions.
Stop Loss: Place it just beyond the level—below S1 for longs, above R1 for shorts. This ensures you’re not stopped out by minor wicks while protecting against a true breakout.
Take Profit: Target the next logical level—PP for S1 bounces, R1 for S2 reversals, and so on. Scaling out—taking partial profits at PP and the remainder at R1—can lock in gains while letting runners capture extended moves.
Understanding support and resistance is critical to implementing these strategies effectively.
| Strategy Type | Market Condition | Entry Signal | Stop Loss Placement | Take Profit Target |
|---|---|---|---|---|
| Long Reversal (Bounce) | Price at Support (S1, S2) | Bullish candlestick, bounce confirmation | Just below the support level | PP, R1, or next resistance level |
| Short Reversal (Bounce) | Price at Resistance (R1, R2) | Bearish candlestick, bounce confirmation | Just above the resistance level | PP, S1, or next support level |
Example: Suppose AUDUSD approaches S1 during the Asian session, forms a bullish hammer, and RSI exits oversold territory. A long entry with a stop below S1 and a target at PP offers a favorable risk-reward setup.
Breakout Strategies
Breakout strategies aim to ride momentum when price pushes through a key pivot level. These are particularly effective after consolidation or in response to news events.
Entry: Wait for a strong candle close beyond R1 or S1. Avoid chasing initial spikes—look for a retest of the broken level as new support or resistance. Volume confirmation adds confidence.
Stop Loss: Place it just inside the broken level—below R1 for longs, above S1 for shorts. Alternatively, use the prior swing high/low for a tighter stop.
Take Profit: Target R2 after breaking R1, or S2 after breaking S1. In strong trends, extending to R3/S3 is possible.
Example: If USDJPY breaks above R1 with three consecutive bullish candles and strong volume, a long entry on retest offers a low-risk opportunity. A stop below R1 and target at R2 creates a solid setup.
Trend Confirmation Strategies
In a strong trend, pivot points act as dynamic support or resistance. Pullbacks to PP or S1 in an uptrend, or rallies to PP or R1 in a downtrend, offer high-probability entries.
Uptrend: After a breakout above PP, look for price to retrace and hold at S1 or PP. A bullish reversal pattern here confirms trend continuation.
Downtrend: After a break below PP, watch for a rally to stall at R1 or PP. A bearish rejection offers a short opportunity.
Combining this with moving averages or MACD can strengthen signals. For example, a retest of S1 that coincides with the 50-period EMA and a bullish MACD crossover increases conviction.
Combining Pivot Points with Other Indicators
While powerful alone, pivot points shine when combined with other tools. Confluence turns good setups into high-probability trades.
- Moving Averages (MAs): A pivot level that aligns with a 50 or 200-period MA becomes a stronger zone. For example, S1 overlapping with the 200 EMA on the 4H chart is a compelling support area.
- RSI / Stochastic: Overbought readings at R1 or oversold conditions at S1 support reversal ideas. Divergence at pivot levels can signal hidden strength or weakness.
- MACD: Bullish crossovers near S1 or bearish crossovers near R1 add confirmation. MACD divergence at key levels can warn of trend exhaustion.
- Candlestick Patterns: Always look for pin bars, engulfing patterns, or inside bars at pivot zones. These provide precise entry timing.
The goal is to build a layered case for each trade. A bounce at S1 is decent. A bounce at S1 with a bullish engulfing, RSI divergence, and 50 EMA support is compelling.
Practical Application: Real-World Pivot Point Examples
Seeing pivot points in action on live charts brings theory to life. Let’s examine how they function in real trading scenarios.
GBPUSD Pivot Point Analysis
GBPUSD is known for its responsiveness to pivot levels, especially during London and New York overlap. Imagine the pair opens below the daily PP after a bearish overnight session. As London traders enter, price attempts a rally but stalls precisely at the PP, forming a bearish pin bar.
This is a textbook bearish confirmation. The PP acts as resistance, and the pin bar shows rejection. A short entry with a stop above the PP and target at S1 offers a clean setup. If S1 breaks, S2 becomes the next target. Conversely, if the pair had opened above the PP, pulled back to test it, and bounced with strong momentum, that would signal bullish continuation, targeting R1 and R2.
Traders often find that GBPUSD respects S1, S2, R1, and R2 more consistently than outer levels, which tend to appear only during extreme moves.
XAUUSD (Gold) Pivot Point Analysis
Gold, or XAUUSD, is influenced by sentiment, real yields, and geopolitical risk. Despite its volatility, it often respects pivot levels. Suppose gold has rallied sharply and opens near R1 the next day. Instead of continuing higher, it forms a double top at R1 with declining volume.
This confluence—resistance at R1 and a reversal pattern—suggests a short opportunity. Enter on breakdown with a stop above R1. Target PP first, then S1 if broken. Gold’s tendency to move fast means that once a level breaks, the next one is often tested quickly. On the flip side, strong bounces off S1 or S2 provide clear long setups with PP or R1 as targets.
Utilizing a Pivot Point Calculator
While manual calculation builds understanding, using a pivot point calculator saves time and reduces errors. These tools generate all levels instantly once you input the prior period’s high, low, and close.
How to use:
- Select the calculation method (Classic, Fibonacci, etc.).
- Choose the timeframe (daily, weekly, monthly).
- Enter the previous session’s price data—or let the calculator auto-fetch it.
- Review the generated PP, R1–R3, and S1–S3 levels.
Look for calculators that support multiple methods, update in real time, and integrate with your broker or platform. Many top Forex brokers offer built-in pivot tools, making them accessible without third-party software.
Risk Management and Common Pitfalls
No strategy survives long-term without sound risk management. Pivot points can guide entries, but discipline protects your capital.
Integrating Pivot Points with Stop Loss and Take Profit
Pivot levels naturally define risk and reward parameters.
- Stop Loss: For a long trade at S1, place the stop just below S1 (or S2 if volatility is high). For a short at R1, place it above R1. This ensures you’re only exposed to a defined risk if the level fails.
- Take Profit: Use the next pivot level as a target. If entering at S1, aim for PP or R1. Consider scaling out—take 50% at PP, let the rest run to R1 with a trailing stop.
Adjust based on volatility. For volatile pairs like GBPJPY or XAUUSD, wider stops may be necessary. For stable pairs like EURCHF, tighter levels work.
Avoiding Common Mistakes
Even experienced traders fall into traps:
- Over-reliance: Using pivot points in isolation ignores trend, news, and fundamentals. Always cross-verify.
- Ignoring Context: Trading a bounce at R1 during a strong uptrend is dangerous. Align with the broader bias.
- Impatience: Entering before confirmation—like a candle close or pattern formation—leads to false signals.
- Wrong Timeframe: Using monthly pivots for scalping or daily pivots for long-term positions reduces effectiveness.
The Limitations of Pivot Points
Pivot points are powerful but not flawless. They can fail in:
- High Volatility: News events like NFP or central bank decisions can cause price to slice through multiple levels.
- Strong Trends: In powerful moves, price may ignore S1/R1 entirely, treating them as minor speed bumps.
- Choppy Markets: When the prior session’s range is narrow, pivot levels cluster tightly, reducing their usefulness.
Recognizing these limitations allows you to adapt—switching to trend-following strategies during breakouts or stepping aside during uncertain conditions.
Conclusion: Harnessing the Power of Pivot Points
Pivot points remain a cornerstone of technical analysis in Forex trading. They offer a clear, objective way to identify potential turning points, assess market bias, and structure trades. From intraday scalping to swing trading, their flexibility makes them indispensable.
Mastering them requires more than memorizing formulas—it demands practice, backtesting, and integration with other tools. Use multi-timeframe analysis for confluence, combine with price action and indicators for confirmation, and always apply disciplined risk management. Whether you’re trading EURUSD, gold, or emerging market pairs, pivot points can sharpen your edge and improve decision-making. The key is consistency, adaptability, and a commitment to continuous improvement in the ever-evolving Forex landscape.
What are the primary benefits of using pivot points in Forex trading?
The primary benefits include identifying potential support and resistance levels, gauging market sentiment for the trading session, and providing clear reference points for setting stop-loss and take-profit orders. They offer a forward-looking perspective based on objective price data, making them a valuable tool for proactive trading decisions.
How do daily, weekly, and monthly pivot points differ, and how should they be used together?
Daily pivot points are derived from the previous day’s price action and are best for intraday trading. Weekly pivot points use the previous week’s data and are more significant for swing traders, while monthly pivot points, based on the previous month’s data, indicate very strong long-term levels often respected by institutional players. They should be used together for confluence: when a daily pivot aligns with a weekly or monthly pivot, its significance as a strong support or resistance level is greatly amplified, providing higher-probability trade setups.
Is there a recommended timeframe for applying pivot point strategies?
There isn’t a single recommended timeframe, as pivot points are adaptable. Intraday traders typically use daily pivots on 15-minute or 1-hour charts. Swing traders might use weekly pivots on 4-hour or daily charts. Position traders might consider monthly pivots on daily or weekly charts. The key is to align the pivot point calculation timeframe with your trading strategy’s timeframe.
Can I use pivot points for trading cryptocurrencies or stocks, or are they exclusive to Forex?
While widely popular in Forex, pivot points are a versatile technical analysis tool that can be effectively applied to other financial markets, including cryptocurrencies, stocks, and commodities. The underlying principle of identifying potential support and resistance levels based on previous price action remains consistent across different asset classes. Traders simply need to ensure the calculation period (daily, weekly, etc.) is appropriate for the asset’s typical trading patterns.
What are the key differences between reversal and breakout strategies using pivot points?
Reversal (bounce) strategies involve trading when the price hits a pivot level and then reverses direction, expecting the level to hold as support or resistance. Breakout strategies, conversely, involve trading when the price decisively breaks through a pivot level, indicating a continuation of momentum in the direction of the break. Reversal strategies are often used in range-bound or moderately trending markets, while breakout strategies are for strong trends or volatile conditions.
How can I integrate risk management principles, like stop-loss and take-profit orders, with pivot point levels?
Pivot points provide natural locations for risk management. For stop-loss, place it just beyond the pivot level you expect to hold (e.g., below S1 for a long trade, above R1 for a short trade). This ensures that if the level fails, your loss is limited. For take-profit, target the next significant pivot level in the direction of your trade. For example, if you enter a long trade at S1, your first take-profit could be at the Pivot Point (PP) or R1. This helps to secure profits at logical price targets.
Where can I find reliable, real-time pivot point data for major currency pairs like EURUSD or USDJPY?
Many reputable Forex brokers offer real-time pivot point calculators and indicators directly within their trading platforms or on their websites. Financial news portals and dedicated technical analysis websites also often provide this data. Ensure the source is reliable and updates the data for the correct previous period’s High, Low, and Close prices.
Are there any specific market conditions where pivot points are less effective or unreliable?
Yes, pivot points can be less effective in highly volatile markets, especially during major news releases or unexpected economic events, where price can quickly breach multiple levels. They may also be less reliable in extremely strong, one-sided trends where momentum overrides minor support/resistance, or in very choppy, directionless markets where the previous period’s range is too narrow, leading to very tightly clustered and less meaningful pivot levels.
How can I practice trading with pivot points without risking real capital?
The best way to practice is by using a demo trading account provided by most Forex brokers. This allows you to apply pivot point strategies in real-time market conditions with virtual money, enabling you to test different calculation methods, experiment with entry and exit points, and refine your risk management without any financial risk. Additionally, backtesting pivot point strategies on historical data can provide valuable insights into their past performance.
What are the common pitfalls or mistakes traders make when using pivot points, and how can they be avoided?
Common mistakes include over-reliance on pivot points as the sole indicator, ignoring broader market context (trend, news), misinterpreting signals by not waiting for proper confirmation (e.g., candlestick patterns), and using them on inappropriate timeframes for a given strategy. To avoid these, always integrate pivot points with other technical tools, consider fundamental analysis, wait for clear confirmation signals before entering trades, and ensure your pivot timeframe aligns with your trading horizon.
發佈留言
很抱歉,必須登入網站才能發佈留言。