
Range Trading Strategy: Mastering Sideways Markets for Profitable Trades
Mastering the Sideways Market: A Comprehensive Guide to Range Trading Strategy
Welcome, fellow explorers of the financial markets. We are embarking on a journey to understand a powerful, albeit demanding, trading strategy: **range trading**. In the dynamic world of investing, prices don’t always surge relentlessly upward or plunge dramatically downward. Often, they move sideways, bouncing between invisible boundaries. This is where range trading comes into its own, offering opportunities to capitalize on this oscillatory behavior.
If you’ve spent time looking at price charts, you’ve likely noticed periods where an asset seems stuck, unable to break above a certain level or fall below another. Think of a ball bouncing between the floor and the ceiling. Range trading is the art and science of playing these bounces, attempting to buy the ball near the floor and sell it near the ceiling.
This strategy requires a different mindset than trend following. Instead of chasing momentum, we are looking for stability within a confined area. It demands precision, patience, and a deep understanding of technical analysis. While potentially profitable in the right conditions, it’s crucial to approach range trading with the seriousness it deserves, equipped with knowledge and discipline.
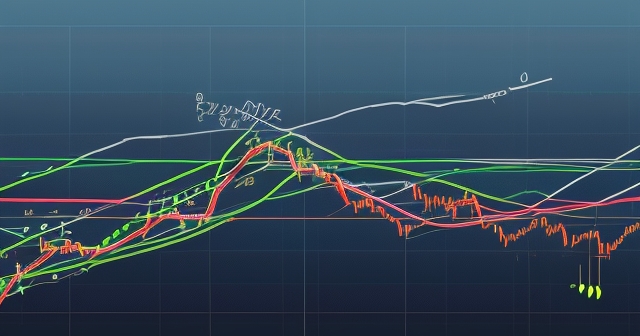
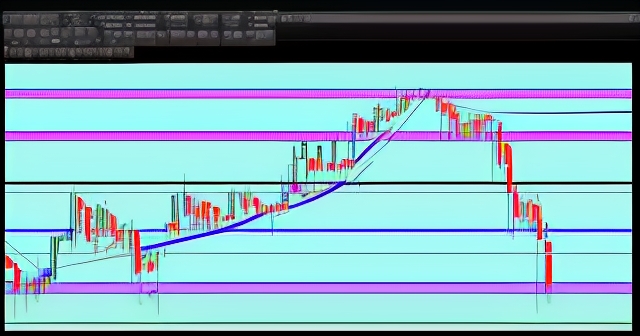
**Range trading** is an active investment strategy focused on identifying assets that are trading within a defined **price range**. This range is typically bounded by a **Support line** at the bottom and a **Resistance line** at the top. The core idea is elegantly simple: buy the asset when its price approaches the support level and sell it when its price nears the resistance level. We repeat this process as long as the asset remains within this predictable corridor.
- Range trading is suited for non-trending or sideways markets.
- This strategy involves identifying support and resistance levels.
- Successful range trading requires strong risk management practices.
| Concept | Description |
|---|---|
| Support Level | Price level where buyers enter, preventing further declines. |
| Resistance Level | Price level where sellers enter, preventing further increases. |
| Range | Defined area between support and resistance where price oscillates. |
Why would we choose this strategy? Primarily, it allows us to generate returns in **non-trending** or **sideways markets** – conditions where trend-following strategies might struggle or yield whipsaw losses. When an asset enters a **range-bound market**, it often signals a period of consolidation or indecision among market participants. Buyers step in at support because they perceive the price as relatively cheap, absorbing selling pressure. Sellers emerge at resistance as they see the price as relatively expensive, overcoming buying pressure. This creates a rhythmic ebb and flow.
For active traders, range trading can offer multiple potential trading opportunities within a single range, assuming it holds for a sufficient duration. It’s about exploiting the temporary equilibrium found between supply and demand at specific price levels.
Consider the market as a constant auction process. In a range, the auction isn’t efficiently discovering a new higher or lower price; instead, it’s bouncing between levels where conviction from one side consistently falters and conviction from the other side takes over. This is a key concept often explored in **Auction Market Theory**, which suggests prices move to find areas of agreement (value) and then push out to find new areas of agreement. A range represents a period where value is relatively stable between two price points.
Understanding this fundamental mechanism is the first step in mastering range trading. It’s not just about drawing lines on a chart; it’s about interpreting the underlying market psychology and dynamics that create those lines in the first place.
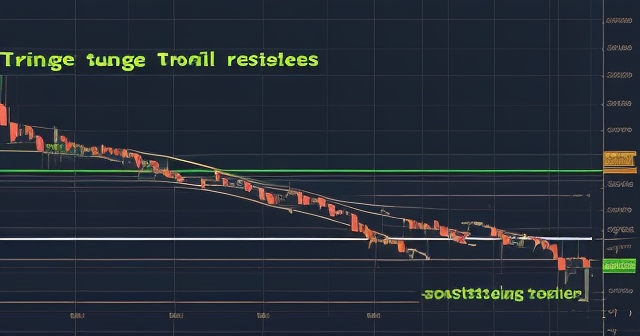
The foundation of range trading lies in our ability to accurately identify the **Support and Resistance lines** that define the trading range. These are not arbitrary lines; they represent price levels where historical price action indicates a significant shift in the balance of supply and demand has occurred repeatedly. How do we find them?
The most common method involves observing past **price action**. Look for levels where the price has:
- Stopped falling and reversed upward (**Support**).
- Stopped rising and reversed downward (**Resistance**).
- Been tested multiple times, confirming their significance.
| Level of Testing | Significance |
|---|---|
| One test | Weak significance for price reversal. |
| Two tests | Moderate significance; potential for price rebound. |
| Three or more tests | High significance; strong support or resistance level. |
The more times a level has acted as support or resistance, and the more significant the price reversals were at those levels, the stronger we can consider that level to be. Think of these levels as psychological barriers or magnets for price.
Drawing these lines accurately is part art, part science. We look for clusters of price highs (for resistance) and price lows (for support) that align horizontally. Often, these aren’t single price points but rather narrow zones. Using different chart timeframes can help confirm these levels; a level that is significant on a 5-minute chart might be minor on a daily chart, and vice versa. For range trading, we typically focus on timeframes relevant to our trading horizon, be it intraday (e.g., 15-minute, 60-minute) or swing trading (e.g., daily, 4-hour).
Beyond just plotting lines, we need to use other technical indicators to confirm that the market is indeed **range-bound** and to gauge the potential strength and validity of the identified range.
One crucial tool is **Volume**. What does volume tell us in a range-bound market? Ideally, we want to see relatively lower **trading volume** *within* the range, especially towards the middle. This suggests a lack of strong conviction from either buyers or sellers, characteristic of consolidation. However, we might see spikes in volume *at* the support and resistance levels, indicating increased activity as price tests these boundaries. High volume at support could suggest strong buying interest absorbing supply, while high volume at resistance might indicate strong selling pressure overcoming demand. Observing volume patterns can help validate if a potential support or resistance level is truly holding.
Next, let’s consider **Moving Averages**. In a trending market, Moving Averages (MAs) typically slope upwards or downwards and are cleanly separated. In a **non-trending market**, especially one trading in a range, **Moving Averages** will often flatten out and may converge or intertwine. This flattening provides visual confirmation that the asset is not experiencing strong directional momentum, making it a potential candidate for range trading. Using multiple MAs (e.g., a 20-period, 50-period, and 100-period) and observing their behavior can reinforce this assessment.
The **Average Directional Index (ADX)** is another powerful indicator for assessing trend strength. The ADX oscillates between 0 and 100. A reading below 20 typically indicates a weak trend or a **non-trending market**, which is precisely the environment suitable for range trading. Conversely, an ADX above 25 or higher suggests a strong trend is in place, and range trading strategies are generally inappropriate under such conditions.
**Bollinger Bands** are also useful. These bands are typically plotted two standard deviations away from a central Moving Average. In a range-bound market, the price will often oscillate between the upper and lower Bollinger Bands. Furthermore, during periods of range contraction, the Bollinger Bands themselves will narrow, reflecting decreased volatility. An expansion of the bands can sometimes foreshadow a potential breakout or breakdown from the range.
For traders utilizing more advanced techniques, **Volume Profile** and **Order Flow** analysis can provide even deeper insights within a range. **Volume Profile** shows the distribution of trading volume at different price levels. In a range, you might see a **Value Area** where most volume has occurred, bounded by **Value Area High** and **Value Area Low**. The **VPOC (Volume Point of Control)** indicates the price level with the highest traded volume. These can act as internal support/resistance levels within the broader range or confirm the significance of the range boundaries. **Order Flow** analysis, often visualized on platforms like **Bookmap**, allows you to see the real-time flow of buy and sell orders, liquidity, and how aggressive buying and selling pressure interact with price levels. Observing **absorption** (large orders being filled without significant price movement) at potential support or resistance levels can provide strong confirmation of the range boundaries.
By combining these tools – identifying strong **Support and Resistance lines**, observing **Volume**, checking **Moving Averages** for flatness, confirming weak trend with **ADX**, and using **Bollinger Bands** or more advanced tools like **Volume Profile** and **Order Flow** – we build a robust case for whether an asset is truly in a tradeable range.
Remember, no single indicator is a silver bullet. The power comes from using these tools in concert to confirm your hypothesis about the market’s current state. Are you seeing consistent bounces off levels *and* indicators confirming a lack of strong trend? That’s the sweet spot for range trading.
Once you’ve identified a potential trading range using the tools discussed, the next step is execution. The basic principle is straightforward: **buy near support, sell near resistance**. But successful execution requires discipline and a clear plan.
Your typical trade setup involves placing buy orders close to the identified **Support line**. You might use limit orders placed directly at or slightly above support, anticipating the bounce. Alternatively, you might wait for price to test support and show signs of reversal (e.g., a bullish candlestick pattern or a bounce confirmed by rising volume) before entering with a market order or a limit order placed slightly higher, confirming the bounce is in play. This latter approach might mean buying slightly higher, but it can reduce the risk of entering a trade just before support breaks.
Conversely, you would look to place sell or target orders near the identified **Resistance line**. Again, this could be a limit order placed at or just below resistance, or you might wait for price to test resistance and show signs of reversal (e.g., a bearish candlestick pattern) before exiting. Some traders might scale out of their position, selling portions as price approaches resistance to lock in profits on some of the trade.
What about exiting the *other* side of the trade? If you bought at support, your primary profit target is resistance. But what if price doesn’t reach resistance and instead falls back towards or through support? This is where **risk management** becomes paramount.
In range trading, the most critical risk is that the price breaks out of the anticipated range. This is why setting a **stop-loss order** is not optional; it’s essential. If you buy near support, your stop-loss order should be placed logically below that support level. The exact placement depends on your risk tolerance and the asset’s volatility, but it should be far enough below support to avoid being triggered by normal price fluctuations (noise) but close enough to limit your potential loss if the range breaks down. A breakdown below support invalidates your buy trade setup, and exiting allows you to preserve capital.
Similarly, if you were trading the range from the short side (selling near resistance, aiming to buy back at support), your stop-loss would be placed above the resistance level. A **breakout** above resistance invalidates your short trade setup.
Think of the stop-loss as your safety net. It defines the maximum loss you are willing to accept on any single trade. In range trading, where success depends on the range holding, the stop-loss is your defense against the strategy failing when the market decides it’s time to trend or find a new equilibrium outside the established boundaries.
| Risk Management Principle | Description |
|---|---|
| Stop-Loss Orders | Set limits on potential losses by exiting trades before major losses. |
| Position Sizing | Allocate appropriate capital to trades to limit exposure. |
| Risk Tolerance Assessment | Evaluate personal risk capacity to determine stop-loss placements. |
**Position sizing** is also a key component of risk management. This refers to the amount of capital you allocate to each trade. You should size your position such that if your stop-loss is triggered, the resulting loss represents only a small, acceptable percentage of your total trading capital (commonly 1-2%). This prevents a few losing trades from significantly impacting your overall account size.
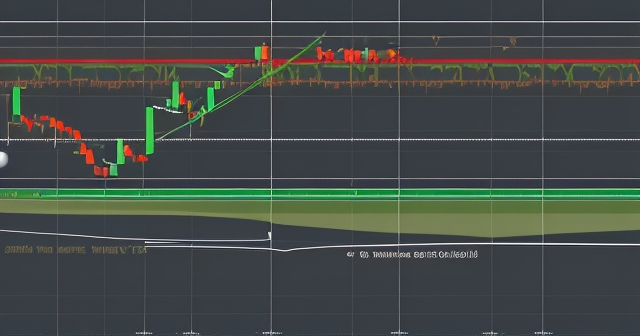
What happens if there’s a **Breakout** (price moves convincingly above resistance) or a **Breakdown** (price moves convincingly below support)? These events signal that the **range-bound market** condition may be over. For a range trader focused on the oscillation *within* the range, this is often a signal to exit any existing range trades and potentially look for new opportunities (perhaps a trend trade in the direction of the breakout/breakdown, or waiting for a new range to form). A breakout or breakdown, especially on high volume, suggests a significant shift in the supply/demand balance and the likely end of the range trading opportunity.
Successful execution in range trading combines accurate identification of the range with a disciplined entry strategy, clear profit targets, and, most importantly, strict adherence to your stop-loss levels. Without robust risk management, a single range failure can wipe out the profits from many successful range trades.
While range trading offers potential profitability in specific market conditions, it is not without its significant challenges and risks. It’s vital to be fully aware of these before deploying capital.
The primary risk in range trading is **market timing**. Success hinges on the assumption that the identified range will hold for a period long enough to execute trades. However, markets are inherently unpredictable. You don’t know when or why a range might break. Unexpected news, a shift in market sentiment, or fundamental changes in the asset’s outlook can cause a sudden and decisive breakout or breakdown, often with little warning. If you are caught in a range trade when this happens without a stop-loss, losses can be substantial.
Another challenge is identifying truly reliable support and resistance levels. While technical analysis provides tools for this, false signals are common. Price might briefly poke above resistance or below support before reversing back into the range (a **false breakout** or **false breakdown**). These can trigger stop-losses unnecessarily or lead to missed opportunities if you exit based on a false signal. Differentiating between a genuine break and a false one often requires confirmation from volume or price closing outside the range on a relevant timeframe, adding layers of complexity.
Range trading is strictly suited for **non-trending markets**. Trying to apply this strategy during a strong upward or downward trend is likely to be highly unsuccessful and costly. The price will simply blow through your resistance (if trying to short) or support (if trying to go long). Therefore, recognizing the current **market condition** is paramount. Is the market trending strongly? Is it consolidating? Is it exhibiting high **volatility** or low volatility?
We need tools like the ADX, Moving Averages, and Bollinger Bands precisely for this reason – to help us differentiate between trend-following environments and range-trading environments. Using the wrong strategy for the prevailing market condition is a recipe for disaster.
Furthermore, range trading, particularly on shorter timeframes, can involve higher transaction costs due to more frequent trading. Slippage (the difference between your intended execution price and the actual execution price) can also be a factor, especially in volatile or less liquid assets, eroding potential profits.
Consider the asset class you are trading. Range trading can be applied to various instruments, including **stocks**, **ETFs**, **futures** (like ES & NQ), **bonds**, and **digital currencies**. However, the characteristics of ranges can differ significantly between these markets. Forex markets, for instance, are known for periods of consolidation and range-bound price action, especially between major news events or during certain times of the trading day. The volatility, typical range size, and factors influencing breakouts can vary greatly.
If you are looking into **Forex** as an asset class for range trading or exploring the diverse range of instruments available via CFDs, then **Moneta Markets** is a platform worth considering. Hailing from Australia, they offer over 1000 financial instruments, catering to both novice and experienced traders.
For example, in the **ES Futures** market, range contractions are common before major economic news releases as participants pause, waiting for new information to drive the next directional move. Understanding these market-specific nuances improves your ability to apply range trading effectively.
Finally, range trading can be mentally taxing. It requires constant monitoring (especially on shorter timeframes), quick decision-making, and the ability to handle frequent, small losses when stop-losses are hit, interspersed with winning trades. It demands patience while waiting for price to reach the range boundaries and discipline to avoid trading in the middle of the range (the “no-man’s-land”). It’s different from **Swing Trading** (which typically holds positions for days or weeks) or pure **Day Trading** (which might not rely on fixed ranges but minute-by-minute price action and order flow), although elements can overlap.
Acknowledging these risks and limitations is not about discouraging you from range trading, but about preparing you to approach it with realistic expectations and the necessary protective measures. It’s a powerful tool, but one that must be used in the right context and with strict discipline.
As you gain experience with range trading, you can begin to refine your approach and look for higher-probability setups. This involves paying closer attention to the subtleties of the market.
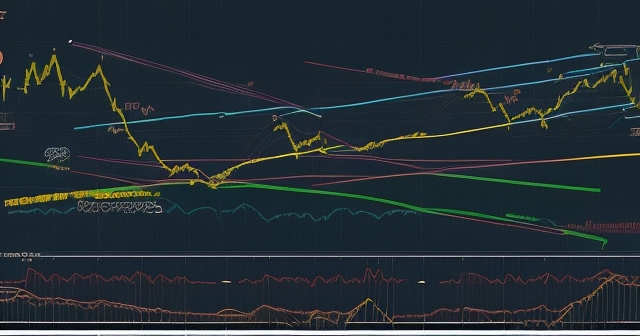
One area of focus is the **duration of the range**. How long has the asset been trading within this range? Ranges that have held for a significant period and been tested multiple times with high volume often imply stronger support and resistance levels. However, exceptionally long ranges can also indicate increasing pressure building up, making the eventual breakout or breakdown potentially more volatile and powerful. It’s a delicate balance.
Paying attention to market fundamentals, even when primarily using technical analysis, can provide context. While range trading focuses on price action, understanding major economic events or news catalysts on the horizon can help anticipate potential range breakouts. For instance, a stock consolidating before an earnings report might be a candidate for a volatility expansion event, potentially ending the range.
Some range traders look for confluence – multiple indicators or techniques giving the same signal. For example, is the price bouncing off a historical support level that also aligns with a key **Volume Profile** level (like the VPOC or Value Area Low) and is confirmed by **Order Flow** analysis showing significant **absorption** by buyers? Such confluence can increase the probability of the support holding.
What about trading within wider ranges versus narrower ranges? Wider ranges offer larger potential profit targets but may take longer to play out and might have more noise within the range. Narrower ranges offer quicker round trips but smaller profit potential per trade and are more susceptible to false breakouts/breakdowns.
You can also explore strategies for trading the *breakout* or *breakdown* itself, not just the bounces within the range. While this shifts from range trading to trend trading (or breakout trading), it’s a natural evolution. A confirmed, high-volume breakout from a well-established range can signal the start of a new trend and offers a different trading opportunity.
Refining your range trading involves continuous learning, reviewing your trades, understanding why some range trades failed (was it a false break? Did the range simply collapse?), and adapting your techniques. It’s an iterative process of improving your identification of ranges, your execution, and your risk management.
One of the appealing aspects of range trading is its applicability across a wide spectrum of financial instruments. While the underlying principle remains the same – buying near support, selling near resistance – the nuances of executing the strategy can differ depending on what you are trading.
In the **stocks** market, individual equities or entire indices often enter periods of consolidation after significant moves. Identifying these ranges involves analyzing the specific stock’s price history, volume, and relevant sector or market-wide dynamics. Larger, more liquid stocks might offer cleaner ranges than smaller, illiquid ones.
**Futures** markets, such as indices (ES, NQ), commodities, or currencies, are also prime candidates for range trading. These markets can exhibit clear ranges, often tied to specific trading sessions, economic data releases, or shifts in global sentiment. The leverage inherent in futures trading amplifies both potential profits and losses, making strict risk management even more critical.
The **Forex** (Foreign Exchange) market, trading currency pairs, frequently exhibits range-bound behavior. Currency pairs often consolidate between major news events or during periods of low volatility. The 24/5 nature of the Forex market means opportunities can arise around the clock, though volatility and range characteristics can vary significantly between sessions (e.g., Asian session vs. London/New York overlap). If you are trading Forex or considering it, understanding how to identify and trade currency ranges is a valuable skill.
Whether it’s **stocks**, **bonds**, **ETFs**, **futures**, or **digital currencies**, the core technical principles of identifying support and resistance, using confirming indicators, and managing risk apply. However, research the specific market you intend to trade. Understand its typical volatility, trading hours, common catalysts for breakouts, and the liquidity of the instrument.
Range trading doesn’t have to be the *only* strategy in your arsenal, but it can be a valuable component. For many active traders, the market presents different types of opportunities at different times. Sometimes, the market is trending strongly, and trend-following strategies are appropriate. At other times, it enters consolidation phases, and range trading becomes relevant. Some traders even specialize in trading breakouts *from* ranges, which is a strategy closely related but distinct from trading *within* the range.
Developing a comprehensive trading plan involves defining:
- The market conditions you will trade (e.g., only non-trending markets below ADX 20).
- The specific criteria for identifying a valid trading range (e.g., minimum number of touches of support/resistance, confirmed by volume).
- Your entry rules (e.g., limit order at support, or market order on reversal confirmation).
- Your exit rules (e.g., target at resistance, or scaling out).
- Your stop-loss placement rules (e.g., X amount below support, or below a specific structural low).
- Your position sizing methodology.
- How you will monitor and manage open trades.
- How you will react to breakouts or breakdowns.
Having a written trading plan provides clarity and helps you maintain discipline, especially during volatile periods or drawdowns. For range trading, this plan should explicitly define when the strategy is applicable and when it is not.
Furthermore, regularly reviewing your trades – both winners and losers – is essential. What worked? What didn’t? Were your ranges well-identified? Was your risk management effective? Did you follow your plan? This iterative process of execution, review, and refinement is how traders improve over time.
Range trading requires dedicated screen time, especially if trading on shorter timeframes. You need to be present to identify ranges as they form and manage trades as price approaches boundaries or stop-loss levels. It’s an active approach that demands commitment.
While the complexity of some tools like Order Flow or Volume Profile might seem daunting initially, start with the basics: support, resistance, volume, and simple Moving Averages or ADX. As you gain confidence, you can gradually incorporate more advanced techniques to enhance your edge. Platforms like TradingView offer comprehensive charting tools, and specialized platforms like Bookmap provide detailed order flow visualization for those trading futures or other order book-driven markets.
Remember, the goal is to consistently apply a sound strategy with disciplined risk management. Profits in range trading come from consistently executing high-probability setups while strictly limiting losses when the market doesn’t behave as expected.
The financial markets are constantly evolving. While the core principles of support and resistance are timeless, the market dynamics, participants, and even the effectiveness of certain indicators can shift over time. For a range trader, continuous learning isn’t just recommended; it’s a necessity.
Stay updated on how different market conditions impact range trading. For example, an environment characterized by low volatility might lead to tighter, choppier ranges, while increasing volatility could lead to wider swings within the range or more frequent breakouts/breakdowns. Global macroeconomic events, central bank announcements, or shifts in inflation expectations (like fears of **stagflation** or the impact of stimuli programs) can all influence market volatility and the likelihood of trending versus ranging periods.
Explore different ways traders identify ranges. Some might use mathematical indicators like the Average True Range (ATR) to gauge volatility and approximate range size. Others might rely purely on visual price action and historical highs/lows. Understanding various approaches can broaden your perspective.
Dive deeper into the indicators you use. For example, understanding the nuances of how **Bollinger Bands** contract before potential volatile moves or how different timeframes of **Moving Averages** interact in a range can provide a finer edge.
Analyze your past trades rigorously. Use a trading journal to track your entry, exit, stop-loss, position size, the specific range characteristics, the indicators you used, and your reasoning. What patterns emerge? Are you consistently identifying strong ranges? Are your stop-losses placed correctly? Are false breakouts a major challenge, and if so, how can you better confirm them?
Learn about different order types beyond basic market and limit orders. Understanding how to use bracket orders (combining entry, target, and stop-loss) or conditional orders can improve execution efficiency and discipline.
Engage with other traders or educational resources. Discussions with experienced range traders can provide valuable insights into practical application and common challenges. However, always filter information and ensure it aligns with sound risk management principles.
The pursuit of knowledge in trading is endless. By committing to continuous learning, especially regarding the tools and techniques specific to range trading and the ever-changing market landscape, you equip yourself to adapt and improve your strategy over time.
Range trading, the strategy of capitalizing on sideways markets by buying near support and selling near resistance, offers a compelling alternative when assets are consolidating rather than trending. It requires a keen eye for technical detail, a deep understanding of market structure, and, above all, unwavering discipline.
We’ve explored how to identify trading ranges using the fundamental concepts of **Support and Resistance**, confirmed by tools like **Volume**, **Moving Averages**, and the **ADX**. We’ve discussed the practical steps of executing trades, emphasizing the critical role of **stop-loss orders** and **position sizing** as your primary defense against the inherent risk of range failure. We’ve also addressed the limitations and challenges, particularly the reliance on precise **market timing** and the need to correctly assess whether the market is genuinely **range-bound**.
Successfully navigating range-bound markets is about more than just drawing lines. It’s about understanding the underlying supply and demand dynamics, using a suite of technical tools to build conviction in your analysis, and executing your plan with precision and strict risk controls. Breakouts and breakdowns are not failures of the strategy but signals that market conditions have changed, requiring adaptation.
For those active traders looking to capitalize on diverse market opportunities across different asset classes, including **Forex**, and seeking reliable tools and execution, exploring platforms that offer comprehensive charting and various instrument types is key. If you are seeking a regulated Forex broker with global trading capabilities, **Moneta Markets** holds multi-country regulatory certifications like FSCA, ASIC, and FSA, offering client fund segregation, complimentary VPS, and round-the-clock Chinese customer support, making it a preferred choice for many traders.
As you venture into or refine your approach to range trading, remember that mastery comes through practice, analysis, and continuous learning. Embrace the challenge, arm yourself with knowledge, adhere to your risk management rules, and approach each range with the respect it deserves. By doing so, you put yourself in a position to potentially profit from the market’s oscillations while protecting your capital when the unexpected occurs. We wish you well on your trading journey!
range trading strategyFAQ
Q:What is range trading?
A:Range trading is a strategy that involves identifying price levels where an asset fluctuates between support and resistance, allowing traders to buy low and sell high within that defined range.
Q:How can I determine support and resistance levels?
A:Support and resistance levels can be determined by analyzing historical price action, looking for levels where the price has reversed multiple times, often confirmed by volume.
Q:What are the primary risks of range trading?
A:The primary risks include market timing issues, false breakouts, and the potential for sudden trend changes that can invalidate the identified range.
發佈留言
很抱歉,必須登入網站才能發佈留言。