
Understanding NDX: The Power of NASDAQ 100 Index
Welcome, fellow traders and investors! We’re here to dive deep into one of the most dynamic and closely watched benchmarks in the financial world: the NASDAQ 100 Index, commonly known as the NDX or US Tech 100. Whether you’re just starting your journey in the markets or you’re looking to refine your understanding of this powerful index, we aim to equip you with the knowledge you need.
Understanding indices like the NDX is foundational to navigating the broader market landscape. It’s not just a number you see flashing on the screen; it’s a composite reflection of market sentiment, sector performance, and macroeconomic forces. Think of it as a vital sign for a specific segment of the economy – in this case, the innovative heart of US technology and growth companies.
Our goal today is to break down the recent performance of the NDX, explore its historical context, examine the factors influencing its movements, and touch upon how you can engage with this index through various trading avenues. We’ll approach this step-by-step, just like learning any new skill, building from the basics to more complex ideas. Are you ready to explore the engine room of the tech market?
To begin with, let’s outline key aspects of the NASDAQ 100:
- The NASDAQ 100 includes the 100 largest non-financial companies listed on the Nasdaq Stock Market.
- It gives a snapshot of the tech-driven segments of the market.
- Its performance is influenced heavily by a few major tech companies known for growth and innovation.
First, let’s clarify what the NASDAQ 100 Index actually represents. The NDX, also identified by symbols like ^NDX or .NDX, is a stock market index comprising the 100 largest non-financial companies listed on the Nasdaq Stock Market. While it’s often referred to as a technology index, it’s important to note that it includes companies from various sectors, including retail, healthcare, telecommunications, media, and biotechnology. However, the technology sector holds a dominant weighting, which is why its performance is heavily influenced by tech giants.
Unlike the NASDAQ Composite Index (^IXIC), which includes all stocks listed on the Nasdaq exchange (over 3,000), the NDX is a more concentrated index focusing on the largest and most actively traded companies. This concentration means the movements of its top constituents have a significant impact on the index’s overall direction. When you see the NDX making a big move, it’s often because a handful of major players are experiencing substantial gains or losses.
Why is this important for you as an investor or trader? Because understanding the composition and weighting of the index helps you anticipate how certain news or sector-specific events might affect the NDX. For example, news affecting major technology companies like Apple, Microsoft, Amazon, or NVIDIA will almost certainly move the NDX.
We can think of the NDX as the premier league of the Nasdaq market – showcasing the top performers based on market capitalization, excluding financial companies. This selection process means the index tends to be forward-looking, heavily weighted towards companies known for innovation and growth potential.
Table of Contents
ToggleDeconstructing Recent NDX Performance and Key Metrics
Let’s look at the recent behavior of the NDX. Market data provides a snapshot of the index’s health at any given moment. Key metrics give us the pulse:
| Metric | Description |
|---|---|
| Current Price | The latest traded value of the index. |
| Daily Change | How much the index value has moved up or down since the previous day’s close. |
| Open, High, Low, Close | These values define the price range for a specific period. |
| Volume | The total number of shares traded for all constituent stocks. |
Recent data points have shown the NDX reaching new 52-week highs. This is a significant technical signal. When an index or stock breaks into new high territory, it can indicate strong buying pressure and positive momentum. For instance, one source noted a high of 20,380.35 on a specific date. Such a level becomes a point of interest for traders, potentially acting as future support if the price pulls back, or confirming the strength of the current uptrend.
Volume is another critical piece of the puzzle. Did the recent move to new highs happen on high volume or low volume? High volume accompanying a price breakout is generally seen as a sign of strength and confirmation of the move. Low volume might suggest less conviction behind the move, making it potentially less sustainable.
By examining these metrics daily, you start to build a picture of the current market sentiment surrounding the NDX. Is it volatile (wide Day’s Range)? Is there strong participation (high volume)? Is the trend undeniably upwards (hitting new 52-week highs)? These are questions technical traders constantly ask.
While the daily fluctuations are important, looking at the NDX’s performance over longer periods provides essential context. Financial platforms often offer historical performance data across various timeframes:
| Timeframe | Performance Data |
|---|---|
| 1 Day | Overview of daily performance. |
| 1 Month | Trends observed over a month. |
| Year-to-Date (YTD) | Performance from the start of the calendar year. |
Analyzing these historical trends reveals the underlying growth trajectory of the index. Data points often show significant gains over longer terms. For example, seeing a double-digit percentage increase YTD or over the past year, or even more impressively, over 100% growth in 5 years, tells a powerful story about the performance of the companies within the NDX over that time. This kind of sustained growth is a hallmark of the technology and growth sectors that dominate the index.
Consider the 5-year performance. A gain of over 100% means the index value has more than doubled. This doesn’t happen linearly. It involves periods of rapid ascent, pullbacks, consolidations, and sometimes sharp declines. Studying the charts for these periods can teach us a lot about market cycles, the impact of economic events, and the resilience of the technology sector.
For investors with a long-term perspective, historical performance is key to understanding the potential return profile of the NDX. It helps set realistic expectations and reinforces the potential benefits of staying invested during periods of volatility. For traders, historical data helps identify long-term trends, potential support and resistance zones based on past price action, and the typical volatility characteristics of the index.
We often look at Year-to-Date (YTD) performance as a quick gauge of how the index is performing within the current calendar year. Comparing the YTD performance across different indices (like the S&P 500 or Dow Jones) gives us insight into which market segments are leading or lagging.
The overall growth trend of the NDX over the past decade has been strongly upward, driven by innovation and the increasing integration of technology into every aspect of life and business. However, past performance is never a guarantee of future results. As we know, markets can change, and indices can experience downturns.
Market Context: How NDX Relates to the Broader Financial World
No index exists in a vacuum. The performance of the NDX is heavily influenced by and, in turn, influences, the broader market and economic environment. To truly understand the NDX, we need to look at its relationships with other major indices and key economic indicators.
Let’s compare the NDX to some other major US benchmarks:
- S&P 500 (^GSPC / US 500): Represents the 500 largest US publicly traded companies across a wider range of sectors.
- Dow Jones Industrial Average (^DJI / Wall Street): Composed of 30 large, well-established US companies (blue chips).
- Russell 2000 (^RUT): Tracks 2,000 small-cap US companies, viewed as a barometer for smaller US businesses.

Why are these comparisons useful? They help us understand if the NDX’s movement is part of a broader market trend or specific to the technology and growth sectors. If all major indices are hitting new highs, it suggests a strong overall market, potentially driven by macroeconomic factors. If the NDX is soaring while the Dow is flat, it might indicate sector-specific bullishness.
Beyond other stock indices, key economic indicators also play a crucial role:
- CBOE Volatility Index (VIX / ^VIX): Often called the “fear index,” the VIX measures expected market volatility based on S&P 500 options prices.
- Interest Rates (e.g., 10-Year Treasury Yield – ^TNX): Interest rates significantly impact growth stocks, which are prominent in the NDX.
- Macroeconomic Data: Reports on inflation, employment, GDP growth, and consumer sentiment all influence market expectations.
Constituent Dynamics: Who’s Driving the NDX?
The NASDAQ 100 is a weighted index, meaning the companies with the largest market capitalizations have the biggest influence on the index’s movement. This is why tracking the performance of the top constituents is vital.
Think of the index as a team, but some players are superstars whose performance counts more than others. The “Magnificent Seven” (Apple, Microsoft, Amazon, Alphabet, NVIDIA, Tesla, Meta Platforms) have historically held significant weight and often dictated the direction of the NDX.
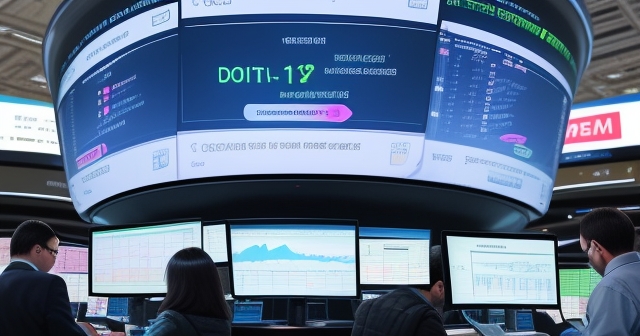
Looking at lists of top-performing and bottom-performing constituent stocks over recent periods gives us insight into which specific companies or sectors within the index are leading or lagging.
Analyzing these lists helps us understand the micro-level drivers of the macro index movement. It’s like diagnosing the health of the team by looking at the performance of individual players. Are the gains broad-based across many constituents, or are they concentrated in just a few names? Broad-based gains are often seen as healthier and more sustainable.
As a highly liquid and widely followed index, the NDX offers numerous avenues for trading and investment beyond simply buying individual constituent stocks. Understanding these instruments is key to choosing how you want to gain exposure.
- Index Funds and ETFs (Exchange Traded Funds): These are popular options for investors who want broad exposure to the NDX’s performance.
- Index Futures: Futures contracts based on the NDX allow traders to speculate on the future price of the index.
- Index Options: Options contracts give traders the right to buy or sell the underlying index at a specific price before a certain date.
- CFDs (Contracts for Difference): These derivative products allow traders to speculate on the price movements of the NDX without owning the underlying assets.
The availability of these different instruments underscores the NDX’s importance as a benchmark for derivative trading. The choice of instrument depends on your trading style, risk tolerance, capital, and investment goals.
Utilizing Data Sources and Trading Platforms
Access to reliable and timely market data is fundamental for anyone tracking or trading the NDX. Fortunately, numerous platforms and data sources provide the necessary information.
- Nasdaq.com and Nasdaq Data Link: The official source provides comprehensive data on the index.
- Financial News Platforms: Major platforms like CNBC, Yahoo Finance, and MarketWatch are invaluable resources.
- Brokerage Trading Platforms: Your broker’s trading platform will be your primary source of real-time data.
- Specialized Data Providers: For more in-depth analysis, services like TipRanks or Bloomberg terminals offer advanced data.
When comparing platforms for trading, especially for instruments like CFDs, consider the platform’s ease of use, stability, available technical tools, and the speed of trade execution.
Technical Analysis on the NDX: Charting the Course
For many traders, particularly those with shorter-term horizons, technical analysis is a primary tool for making decisions about the NDX.
What kind of technical analysis can we apply?
- Trend Identification: Is the NDX in an uptrend, downtrend, or trading sideways?
- Support and Resistance Levels: These are price levels where the index has historically found difficulty moving past.
- Chart Patterns: Traders look for classic patterns on the NDX chart.
- Technical Indicators: Indicators like the Relative Strength Index (RSI) provide insights into momentum.
Trading platforms offer the charting tools necessary to perform these analyses on the NDX.
Risk Management When Trading the NDX
Whether you’re trading the NDX through ETFs, futures, options, or CFDs, managing risk is paramount.
How can we approach risk management?
- Position Sizing: Never risk too large a percentage of your trading capital on a single trade.
- Setting Stop-Loss Orders: These are automated orders placed with your broker to sell your position if the price falls to a certain level.
- Setting Take-Profit Orders: A take-profit order automatically closes your position when the price reaches your target level.
- Understanding Leverage: Instruments like futures and CFDs offer leverage, amplifying both potential profits and losses.
The Role of Market News and Sentiment
Market news and overall sentiment act as powerful catalysts for index movements, including the NDX.
Key categories of news influencing the NDX include:
- Economic Data Releases: Reports on inflation, employment, GDP, and consumer confidence.
- Central Bank Announcements: Decisions from the Federal Reserve regarding interest rates.
- Company-Specific News: Earnings reports and product launches of major NDX constituents.
- Sector-Specific News: Developments within key sectors represented in the NDX.
Comparing NDX Globally: A World View
The US market, particularly the technology sector represented by the NDX, does not operate in isolation. Global markets are increasingly interconnected.
Financial data often includes comparisons to indices in Europe, Asia, and the Americas:
- Europe: FTSE 100, DAX, CAC 40.
- Asia: Nikkei 225, Hang Seng Index, SSE Composite.
- Americas (ex-US): S&P/TSX Composite, IBOVESPA.
Developing a Trading Strategy for the NDX
With an understanding of the NDX’s composition and performance metrics, you are better equipped to develop a trading strategy.
Your strategy should align with your goals, risk tolerance, and available capital. Some common approaches include:
- Long-Term Investing: Buying and holding NDX ETFs.
- Swing Trading: Capturing short- to medium-term price swings.
- Day Trading: Opening and closing positions within the same trading day.
- Options Trading: Using NDX options for speculation or income generation.
Conclusion: Navigating the NDX Landscape
The NASDAQ 100 Index is undeniably a powerful and influential benchmark, reflecting the performance of leading companies at the forefront of innovation and growth.
For both novice investors and experienced traders, gaining a deep understanding of the NDX is an ongoing process. It requires continuous learning, adaptation to changing market conditions, and diligent risk management.
$ndxFAQ
Q:What is the NDX?
A:The NDX is the NASDAQ 100 Index, representing the 100 largest non-financial companies listed on the Nasdaq Stock Market.
Q:How does the NDX relate to other indices?
A:The NDX is often compared to the S&P 500 and Dow Jones, with its performance indicating trends in the technology sector.
Q:What trading instruments can I use with the NDX?
A:Investors can trade NDX through ETFs, index futures, options, and CFDs, offering various strategies for exposure.
You may also like
Calendar
| 一 | 二 | 三 | 四 | 五 | 六 | 日 |
|---|---|---|---|---|---|---|
| 1 | 2 | 3 | 4 | 5 | 6 | 7 |
| 8 | 9 | 10 | 11 | 12 | 13 | 14 |
| 15 | 16 | 17 | 18 | 19 | 20 | 21 |
| 22 | 23 | 24 | 25 | 26 | 27 | 28 |
| 29 | 30 | 31 | ||||
發佈留言
很抱歉,必須登入網站才能發佈留言。