US Dollar Chart: How Understanding DXY Can Boost Your Trading Strategy
Understanding the U.S. Dollar Index (DXY): A Key Indicator for Traders
Welcome! As you navigate the complex world of financial markets, you quickly discover that understanding key indicators is paramount to making informed decisions. One such vital benchmark, especially if you’re looking at global markets or forex, is the U.S. Dollar Index, commonly known as the DXY.
Think of the DXY as a report card for the U.S. dollar. It doesn’t just tell you if the dollar is stronger or weaker on any given day; it tells you how it’s performing against a specific basket of other major global currencies. Why is this important? Because the U.S. dollar isn’t just the national currency; it’s the world’s primary reserve currency, the backbone of international trade, and a significant factor in the pricing of many global assets, from oil to gold to stocks.
Whether you’re just starting out in investing or you’re an experienced trader seeking to refine your technical analysis, gaining a deep understanding of what moves the DXY and how to interpret its chart can provide invaluable insights. In this guide, we will explore the DXY’s recent performance, dissect the powerful forces shaping its value, dive into the technical picture, and discuss how its movements ripple through other asset classes.
We’re here to help you decode these signals. Let’s embark on this journey together to build your knowledge and confidence.

The DXY’s Current Position and Recent Performance Snapshot
To begin our analysis, let’s look at where the DXY stands right now and its journey over the recent past. The index has been particularly dynamic lately, reflecting the shifting landscape of global economics and monetary policy.
Recently, the U.S. Dollar Index has been trading near multi-week highs. This isn’t a random occurrence; it signals a period where the dollar has gained strength relative to the currencies in its basket. Specific levels we’ve observed include trading in ranges around 104.88, pushing towards 105.18, and even touching 105.58, depending on the exact timeframe and data source you consult. These levels aren’t just numbers; they represent the culmination of global supply and demand forces for the U.S. dollar.
| Timeframe | YTD Change | Notable Gains |
|---|---|---|
| February 2023 | 1.60% | 8.76% |
| June 2024 | 3.21% | – |
| July 2024 | 3.5% | – |
Looking at performance across different timeframes gives us perspective. While values fluctuate, data points from earlier in the year showed Year-to-Date (YTD) changes around 1.60% (like in February 2023). More recent periods have shown YTD gains closer to 3.5% (July 2024) or 3.21% (June 2024). Over a one-year horizon, figures have also varied, from notable gains like 8.76% (February 2023) during a period of aggressive Fed tightening, to more moderate increases around 1.45% (July 2024). These figures highlight the dollar’s significant volatility and its responsiveness to major economic shifts over time.
Consider the 52-week trading range. This shows the extreme high and low points the DXY has reached over the past year. Observing this range helps you understand the potential amplitude of its moves and where the current price sits within that historical context. Is it closer to the highs, suggesting strong upward momentum, or nearer the lows, perhaps indicating a potential reversal or consolidation?
Understanding the DXY’s current level and its recent trend is our starting point. But what are the underlying engines driving this performance? Let’s delve deeper.
Deconstructing the DXY: What’s in the Basket?
Before we analyze *why* the DXY moves, it’s crucial to understand *what* it actually measures. The U.S. Dollar Index isn’t just a comparison against *one* currency; it’s a weighted geometric mean of the dollar’s value relative to a basket of six major world currencies. This specific composition is key to interpreting its movements.
The six currencies and their approximate weightings are:
- Euro (EUR): 57.6%
- Japanese Yen (JPY): 13.6%
- Pound Sterling (GBP): 11.9%
- Canadian Dollar (CAD): 9.1%
- Swedish Krona (SEK): 4.2%
- Swiss Franc (CHF): 3.6%
Look closely at those percentages. What do you notice? The Euro accounts for well over half of the index’s value. This means that movements in the EUR/USD exchange rate have an outsized impact on the DXY. If the Euro weakens significantly against the dollar, the DXY will likely rise, even if the dollar’s performance against the other currencies in the basket is relatively flat. Conversely, if the Euro strengthens against the dollar, it will exert downward pressure on the DXY.

This is a critical point for traders. When you see the DXY moving, a significant portion of that move could be attributed to what’s happening with the Euro. While the other currencies play a role, the EUR is the dominant force. Understanding the economic and political factors specifically affecting the Eurozone is therefore essential for analyzing the DXY.
The index is maintained by ICE Futures U.S. and was established in 1973 with a base value of 100. So, a DXY value of 105 means the dollar has gained 5% in value against the basket since 1973. A value of 95 would mean it has lost 5%. While 1973 feels like a long time ago, the base value helps provide a historical anchor.
Now that we know what makes up the index, let’s look at the primary force currently shaping its trajectory: the decisions and signals from the U.S. central bank.
The Federal Reserve’s Powerful Influence: Interest Rates and Rate Cut Expectations
Perhaps the most significant single factor driving the U.S. Dollar Index is the monetary policy set by the U.S. Federal Reserve (the Fed). The Fed controls the federal funds rate, which is the target interest rate for banks. Changes in this rate, and perhaps even more importantly, changes in market *expectations* about future changes, profoundly impact the dollar’s value.
How does this work? When the Fed raises interest rates, it generally makes dollar-denominated assets (like U.S. Treasury bonds) more attractive to global investors seeking higher yields. This increased demand for dollar assets translates into increased demand for the U.S. dollar itself, causing its value to rise. Conversely, when the Fed cuts interest rates, U.S. assets may become less attractive compared to those in countries with higher rates, potentially leading to capital outflows and a weakening dollar.
Recently, the DXY’s strength has been closely tied to a reassessment of interest rate cut expectations. Earlier forecasts had anticipated multiple rate cuts from the Fed in 2024. However, persistent inflation and resilient economic data have led the Fed to adopt a more patient stance. Recent projections from the Fed have indicated potentially only one rate cut in 2024, a significant shift from earlier, more dovish outlooks.
Statements from Fed officials also carry significant weight. For example, comments from governors like Neel Kashkari, who has reiterated the likelihood of a single cut this year, provide direct policy guidance that reinforces the market’s revised expectations. Each speech, every press conference, and certainly every Federal Open Market Committee (FOMC) meeting announcement is scrutinized for clues about the future path of interest rates.
When the market reduces its expectation for rate cuts, it essentially means investors anticipate that U.S. interest rates will remain higher for longer than previously thought. This ‘higher for longer’ narrative increases the relative attractiveness of dollar assets, providing upward pressure on the U.S. dollar’s exchange rate against other currencies, and consequently, boosting the DXY.
Understanding the intricate dance between economic data, Fed communication, and market expectations is crucial. It’s not just about what the Fed does, but what traders *think* the Fed will do based on the available information.
Decoding U.S. Economic Data: Inflation, Jobs, and Consumption
While the Federal Reserve’s policy is paramount, their decisions are heavily influenced by the health of the U.S. economy. This is why economic data releases are market-moving events for the DXY. Key reports give us insights into inflation, employment, and consumer spending – the pillars the Fed watches closely.
Inflation data is perhaps the most critical input for the Fed right now. Reports like the Consumer Price Index (CPI) and the Personal Consumption Expenditures (PCE) price index tell us whether inflation is moving towards the Fed’s 2% target. If inflation remains stubbornly high, it reduces the likelihood of the Fed cutting rates, which, as we just discussed, is bullish for the dollar. Recent data showing softer inflation figures can sometimes temper dollar strength if they increase the chances of a rate cut, but the overall trend still points to slower disinflation than initially hoped.
Employment data, such as the Non-Farm Payrolls report, provides a snapshot of the labor market’s strength. A strong job market often indicates a healthy economy, which can support higher interest rates and a stronger currency. Conversely, a weakening job market might prompt the Fed to consider rate cuts sooner.
Retail sales data measures consumer spending, a major driver of economic growth in the U.S. Robust retail sales suggest strong consumer confidence and economic momentum, again supporting the case for potentially higher rates or at least delaying cuts, which favors the dollar. Upcoming releases like retail sales and Flash PMI (Purchasing Managers’ Index, an indicator of economic activity in manufacturing and services) are always on traders’ calendars, as their outcomes can immediately shift market sentiment and DXY value.
| Economic Indicator | Impact on Dollar |
|---|---|
| Consumer Price Index (CPI) | Higher inflation suggests Fed will maintain or raise rates, bullish for dollar |
| Non-Farm Payrolls | A strong job market supports higher rates, bullish for dollar |
| Retail Sales | Strong sales indicate economic momentum, supports dollar strength |
Each piece of economic data acts like a puzzle piece for the Fed and for currency traders trying to predict the Fed’s next move. Does the data suggest the economy is strong enough to withstand higher rates? Is inflation cooling sufficiently? The answers to these questions directly feed into interest rate expectations and, thus, the DXY’s trajectory.
Global Headwinds and External Boosts: Europe’s Turmoil and Beyond
The DXY measures the dollar against a basket of other currencies, so it’s not just what happens in the U.S. that matters. Economic and political developments in the countries of the basket currencies also play a significant role. One recent external factor providing an external boost to the U.S. Dollar Index has been political instability in Europe.
Political uncertainty in major economies tends to weaken their currencies as investors become more cautious. Given the Euro’s dominant weighting in the DXY basket, political turmoil in key European countries, leading to a depreciation of the Euro against the dollar (EUR/USD pair falls), directly causes the DXY to rise. The dollar often benefits from a “safe-haven” flow during times of global uncertainty, meaning investors move capital into dollar-denominated assets because the U.S. is perceived as a relatively stable economy and the dollar is highly liquid.
Other global factors can also influence the DXY:
- Central Bank Actions Abroad: Decisions by the European Central Bank (ECB), Bank of Japan (BOJ), Bank of England (BOE), and others impact their respective currencies’ strength against the dollar. For instance, if other central banks start cutting rates before the Fed, it can make the dollar relatively more attractive.
- Geopolitical Events: Major global conflicts or tensions (like the Russia-Ukraine conflict’s impact on global markets) can increase demand for the dollar as a safe asset.
- Commodity Prices: As many commodities are priced in dollars, a stronger dollar can make them more expensive for holders of other currencies, potentially reducing demand and prices, creating a dynamic feedback loop.
- Political Developments: Events like the upcoming US election can introduce uncertainty and volatility, potentially impacting the dollar’s outlook depending on perceived policy implications.
The DXY is therefore a reflection of both domestic U.S. conditions and the relative performance and stability of other major global economies. You need to keep an eye on the global news headlines just as much as the U.S. economic calendar.
Market Sentiment and the Technical Outlook for the DXY
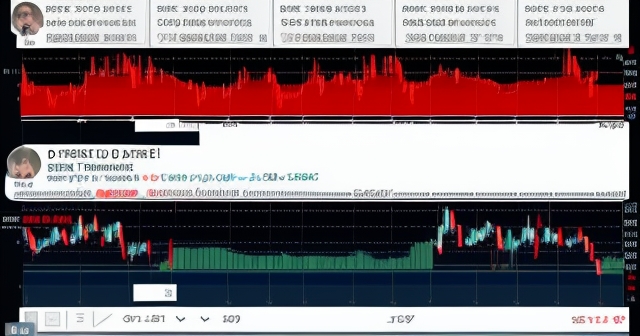
Beyond fundamental factors like interest rates and economic data, market sentiment and technical analysis play crucial roles in shaping the DXY’s short-term movements. Technical analysis involves studying price charts to identify patterns and levels that might indicate future price action.
Traders using technical analysis on the dollar chart look for key support and resistance levels. A support level is a price point where buying interest is expected to be strong enough to prevent the price from falling further. A resistance level is a price point where selling interest is expected to be strong enough to halt or reverse an advance. Identifying these levels helps traders anticipate potential turning points or areas where momentum might accelerate.
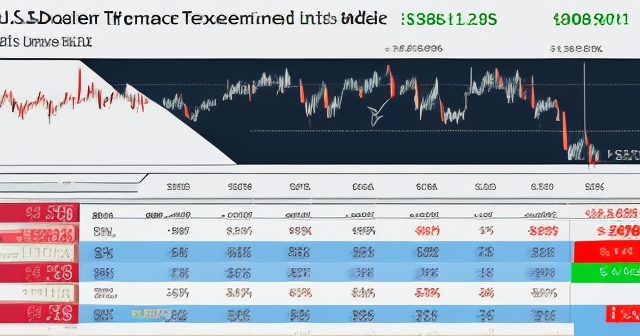
For the DXY recently, technical observations have highlighted support levels around the 104.97 area. This suggests that if the index were to pull back, this level could act as a floor, potentially attracting buyers. On the upside, potential resistance has been noted around 106.50. Breaking above such a resistance level could signal strong bullish momentum and pave the way for further gains.
Other technical patterns observed by analysts include:
- Trading Channels: Prices often move within defined upper and lower boundaries, forming channels. Trading at the edges of these channels can offer potential entry or exit points.
- Gap Fills: Sometimes, the market opens at a price significantly different from where it closed, creating a ‘gap’ on the chart. Technical theory suggests these gaps are often ‘filled’ as prices later trade back into the gap area.
- Wave Structures: Some advanced technical analysts use methodologies like Elliott Wave Theory to identify potential price patterns based on perceived market psychology cycles.
Market sentiment – the overall feeling or attitude of investors towards the dollar – is also a significant factor. If sentiment is broadly bullish on the dollar due to safe-haven demand or strong rate expectations, dips may be quickly bought up. Conversely, if sentiment is bearish, rallies might be sold into. This sentiment is often reflected in the price action and technical patterns.
While technical analysis doesn’t guarantee future outcomes, it provides a framework for understanding price dynamics and potential trading opportunities based on historical patterns and current price behavior. Combining technical analysis with fundamental understanding of factors like Fed policy and economic data offers a more comprehensive view.
Understanding Correlations: How the DXY Impacts Other Assets
Because the U.S. dollar is so central to the global financial system, movements in the DXY have significant implications for other asset classes. Understanding these correlations is crucial for managing a diversified portfolio or identifying related trading opportunities.
One of the most commonly observed correlations is between the U.S. Dollar Index and commodities, particularly gold and oil. Commodities like gold and oil are often priced in U.S. dollars on international markets. When the DXY strengthens, it takes more of other currencies to buy the same amount of dollars, making these dollar-denominated commodities effectively more expensive for buyers holding Euros, Yen, or Pounds, for example. This can reduce demand and put downward pressure on commodity prices. Thus, you often see an inverse relationship: a stronger dollar tends to correlate with weaker commodity prices, and vice versa. This is why Gold (XAU/USD) often moves in the opposite direction of the DXY.
| Asset Class | Correlation with DXY | Description |
|---|---|---|
| Commodities (Gold, Oil) | Inverse | Stronger dollar makes commodities more expensive for foreign buyers, reducing demand. |
| Stock Markets | Mixed | Dollar strength during growth periods supports stocks; during safe-haven demand, stocks may fall. |
| Treasury Yields | Direct | Higher yields attract dollar investment, reinforcing dollar strength. |
The relationship between the DXY and stock markets (like the S&P 500, Nasdaq, and Dow) is more complex and can vary depending on the underlying reason for the dollar’s movement. Generally:
- If the dollar is strengthening due to strong U.S. economic growth and positive sentiment, stocks might also perform well (a positive correlation).
- However, if the dollar is strengthening due to safe-haven demand driven by global uncertainty or tightening Fed policy (which can slow the economy), stocks might fall (a negative correlation).
Similarly, Treasury yields (the interest rates on U.S. government bonds) are closely linked to the dollar. Higher Treasury yields make dollar-denominated assets more attractive, typically supporting a stronger dollar. The Fed’s monetary policy directly influences short-term yields, while longer-term yields are also affected by inflation expectations and economic outlook, all of which feed back into the dollar’s strength.
Movements in the DXY also directly impact individual currency pairs. For instance, a rising DXY implies the dollar is strengthening against the Euro, Yen, and Pound. This means pairs like EUR/USD, GBP/USD, and AUD/USD are likely falling, while pairs like USD/JPY and USD/CAD are likely rising.
Being aware of these correlations helps you see the bigger picture. A move in the DXY isn’t an isolated event; it sends ripples across the financial ecosystem.
If you’re exploring opportunities in foreign exchange or looking at the broader range of financial instruments impacted by currency movements, understanding platforms that offer comprehensive market access is key. Moneta Markets is an Australian-based platform that provides access to over 1000 financial instruments, including a wide array of forex pairs and CFDs, potentially suiting both beginner and experienced traders.
Historical Perspectives and Future Forecasts
Looking at the DXY’s historical performance provides valuable context. The index has seen significant swings over the years, reflecting periods of aggressive Fed tightening, global financial crises, shifts in international trade dynamics, and varying levels of confidence in the U.S. economy compared to others.
For instance, the period of aggressive rate hikes by the Fed in 2022 led to substantial strength in the dollar and a sharp rise in the DXY. Conversely, periods where the Fed was cutting rates or engaging in quantitative easing (like after the 2008 financial crisis or in 2020) generally correlated with a weaker dollar.
Examining the DXY’s 52-week range, as mentioned earlier, helps highlight the typical volatility. Peaks and troughs often correspond with major economic or policy turning points. Studying these historical cycles can sometimes offer clues about potential future behavior, although past performance is never a guarantee of future results.
What about forecasts? Predicting currency movements is notoriously difficult, as they are influenced by such a vast array of global factors. However, financial institutions and research firms regularly publish forecasts based on their economic models and outlooks. For example, forecasts mentioned in the data suggested the dollar might remain near current levels in the near term, with the DXY projected around 104.93 by the end of a recent quarter or potentially slightly higher towards 105.85 in 12 months (as of June 2024 data). These forecasts are based on specific assumptions about Fed policy, inflation, and global conditions, and they are subject to change as new information emerges.
It’s important to treat forecasts as just one piece of the puzzle. They offer a potential scenario based on current information, but the market is constantly reacting to new data and events. Your own analysis, combining fundamentals and technicals, will be your most valuable tool.
Applying DXY Analysis to Your Trading Strategy
Now that we’ve dissected the DXY, how can you use this knowledge in your own trading or investing? Understanding the DXY can enhance various strategies, especially if you are involved in forex or trading global assets.
Here are a few ways to integrate DXY analysis:
- Forex Trading Confirmation: If you are trading a specific currency pair like EUR/USD, checking the DXY can provide confirmation or contradiction for your trade idea. If your analysis suggests EUR/USD should fall, you’d expect the DXY to be rising. If it’s not, it might signal that the move in EUR/USD is more about Euro weakness than broad dollar strength, or vice-versa, prompting you to re-evaluate.
- Identifying Broad Dollar Trends: The DXY helps you see the overall trend in the dollar’s strength or weakness against a basket of currencies. This is useful because the dollar tends to move in a correlated manner against many pairs. Identifying a strong upward DXY trend might encourage you to look for opportunities to buy the dollar against weaker currencies or avoid selling the dollar.
- Analyzing Commodity Trades: Given the inverse correlation, a strong DXY trend might make you more cautious about taking long positions in dollar-denominated commodities like gold or oil. Conversely, a weakening DXY could signal potential tailwinds for these assets.
- Gauging Risk Sentiment: Often, when the DXY rises due to safe-haven flows, it correlates with a decline in riskier assets like stocks. While not always the case, a rapidly rising DXY can sometimes be an early warning sign of increasing market jitters.
- Comparing Relative Strength: By watching the DXY alongside individual currency pairs, you can assess whether a move is primarily dollar-driven or specific to the other currency in the pair. For example, if the DXY is flat but USD/JPY is rising, the move is likely driven by Yen weakness. If the DXY is rising sharply and USD/JPY is also rising, it’s likely a combination of dollar strength and Yen weakness.
Integrating DXY analysis adds another layer to your decision-making process. It helps you understand the ‘big picture’ currency environment rather than looking at individual pairs in isolation.
When considering how to implement these strategies, having access to reliable trading platforms and a wide range of instruments is beneficial. In this context, platforms supporting popular interfaces like MT4, MT5, or Pro Trader, combined with features like high-speed execution and competitive spreads, can significantly enhance your trading experience. Finding a broker that offers such technological advantages and flexibility, like Moneta Markets, can be a key part of putting your analysis into action.
The Role of Technical Indicators on the DXY Chart
Beyond basic support and resistance, technical analysts often employ various indicators to gain further insight into the DXY’s momentum, trend strength, and potential reversals. Understanding how these indicators are used on the DXY chart can deepen your analytical skills.
Commonly used technical indicators include:
- Moving Averages (MAs): These smooth out price data to create a single flowing line, making it easier to spot trends. Different periods (e.g., 50-day, 200-day moving average) are used to identify short-, medium-, and long-term trends. Crossovers of different moving averages can generate buy or sell signals.
- Relative Strength Index (RSI): This momentum oscillator measures the speed and change of price movements. It oscillates between 0 and 100, with readings above 70 often considered overbought (potentially due for a pullback) and readings below 30 considered oversold (potentially due for a bounce). Analyzing RSI divergences with price action can also signal potential trend changes.
- Moving Average Convergence Divergence (MACD): This trend-following momentum indicator shows the relationship between two moving averages of a security’s price. It’s calculated by subtracting the 26-period Exponential Moving Average (EMA) from the 12-period EMA. A 9-period EMA of the MACD line (the signal line) is then plotted on top of the MACD line, which functions as a trigger for buy and sell signals. Crossovers and divergences are key signals.
- Bollinger Bands: These volatility bands are placed above and below a simple moving average. They expand and contract based on market volatility. Prices often tend to stay within the bands, and moves reaching the upper or lower bands can suggest overbought or oversold conditions, respectively.
Applying these indicators to the DXY chart can help you objectively measure momentum, identify potential exhaustion points in trends, and confirm signals from price action or fundamental analysis. For instance, if the DXY is approaching a key resistance level and the RSI is showing overbought conditions, it might strengthen the case for a potential reversal or pause in the trend.
Remember, no single indicator is foolproof. The most effective technical analysis usually involves combining multiple indicators and using them in conjunction with price action analysis and your understanding of the underlying fundamental drivers.
The DXY and Global Economic Cycles
The U.S. Dollar Index isn’t just a short-term trading instrument; its long-term movements often reflect major shifts in global economic cycles. Understanding this broader context can help you appreciate the significance of its trends.
Historically, the dollar has often strengthened during periods when the U.S. economy is relatively stronger or growing faster than its peers, or when the U.S. Federal Reserve is tightening monetary policy while other central banks are more dovish. This was evident in the early 1980s, the late 1990s tech boom, and more recently during the Fed’s hiking cycle in 2022-2023.
Conversely, periods of relative U.S. economic weakness, lower interest rates compared to other major economies, or periods of strong global growth outside the U.S. can lead to a weaker dollar and a declining DXY. This was seen in periods like the mid-2000s before the financial crisis.
The DXY can also act as a barometer of global risk appetite. During times of heightened global uncertainty or financial stress, capital tends to flow into perceived safe havens, and the U.S. dollar often benefits from this. This flight-to-safety bid can cause the DXY to spike, even if the U.S. economy isn’t particularly strong at that moment.
By observing the multi-year trends in the DXY, you can gain a macro perspective on how the U.S. economy and financial system are performing relative to the rest of the developed world. Are we in a period of dollar dominance, or are conditions setting up for a potential shift in global currency dynamics?
Considering these long-term cycles adds depth to your understanding. It moves you beyond just reacting to daily news and helps you place current price action within a larger historical and economic context.
Navigating the DXY with Confidence: Combining Analysis and Strategy
We’ve covered the DXY’s composition, the powerful influence of the Federal Reserve, the impact of economic data and global events, the insights from technical analysis, the correlations with other assets, and the perspective offered by historical cycles. That’s a significant amount of ground, isn’t it?
The key takeaway is that the DXY is a multi-faceted indicator. Its movements are rarely due to a single factor but rather a confluence of forces. To effectively analyze the DXY, you need to:
- Understand the relative weightings of the currencies in its basket, especially the Euro’s dominance.
- Stay informed about the Federal Reserve’s monetary policy stance and anticipate market expectations for interest rate changes.
- Monitor key U.S. economic data releases and understand their potential impact on Fed policy.
- Keep an eye on major global political and economic developments, particularly in Europe.
- Use technical analysis to identify key price levels, trends, and potential turning points on the DXY chart.
- Be aware of how DXY movements typically correlate with assets like commodities and stocks.
There is no magic formula, but by diligently combining these areas of analysis, you build a more robust picture of the forces at play. This integrated approach is far more powerful than relying on any single piece of information.
For anyone serious about trading or investing in global markets, especially forex, the DXY is an indispensable tool. Mastering its analysis requires patience, continuous learning, and the ability to synthesize information from various sources.
As you develop your trading strategies and refine your approach, having access to a reliable and well-regulated broker is essential. If you are searching for a broker that offers global trading capabilities and regulatory oversight, consider options that have multiple regulatory licenses and provide client fund segregation. Moneta Markets, for instance, holds regulations from bodies like FSCA, ASIC, and FSA, offering fund trust accounts and support services like free VPS and 24/7 Chinese customer service, which can be important considerations for traders.
Conclusion: The Ever-Evolving Picture of Dollar Strength
In conclusion, the U.S. Dollar Index (DXY) currently reflects a market grappling with shifting expectations for U.S. monetary policy, navigating persistent inflation concerns, and reacting to external shocks like political uncertainty in Europe. Its position near multi-week highs is a testament to the relative attractiveness of the U.S. dollar in the current global environment, driven primarily by the perception that U.S. interest rates will likely remain higher for longer than previously anticipated.
We have seen how the Fed’s projections for a single rate cut, reinforced by official commentary, have been a primary catalyst. We’ve also explored how U.S. economic data, from inflation to retail sales, constantly feeds into this outlook, and how geopolitical factors and the specific composition of the DXY basket, with the Euro’s heavy weighting, amplify certain moves.
Looking ahead, the trajectory of the DXY will continue to be determined by the complex interplay of these factors. Will U.S. inflation finally cool enough to prompt the Fed to accelerate rate cuts? Will the global economic picture stabilize, reducing the dollar’s safe-haven appeal? Will political events in Europe or elsewhere trigger further currency volatility? These are the questions that will shape the dollar chart in the coming weeks and months.
For you as a trader or investor, staying informed on these developments, continuously honing your analytical skills (both fundamental and technical), and understanding the DXY’s impact on other assets are crucial steps towards navigating these markets successfully. The DXY is more than just a number; it’s a dynamic indicator reflecting the pulse of the global financial system relative to the strength of the world’s dominant currency. By understanding its nuances, you gain a powerful tool for potentially identifying opportunities and managing risk in your trading journey.
Keep learning, keep analyzing, and approach the markets with confidence based on solid knowledge.
us dollar chartFAQ
Q:What is the U.S. Dollar Index (DXY)?
A:The DXY measures the value of the U.S. dollar against a basket of six major currencies, serving as a key indicator of dollar strength.
Q:How does the Federal Reserve influence the DXY?
A:The Fed’s interest rate policies affect demand for dollar-denominated assets, influencing the dollar’s value and, consequently, the DXY.
Q:What role does the Euro play in the DXY?
A:The Euro has the largest weighting in the DXY, meaning its movements significantly impact the index’s performance.
發佈留言
很抱歉,必須登入網站才能發佈留言。