VIX Meaning in English: Unpacking the ‘Fear Index’ and What It Reveals About Market Volatility
Table of Contents
ToggleIntroduction: What is the VIX Index and Why Does it Matter?

In the fast-moving world of finance, few tools offer as much insight into the emotional undercurrents of the market as the VIX Index. Often referred to as the “fear gauge,” this metric provides a real-time snapshot of expected market volatility over the next 30 days. Officially known as the CBOE Volatility Index, the VIX reflects the collective expectations of options traders regarding future price swings in the S&P 500. It’s not just a number pulled from thin air—it’s a calculated reflection of market psychology, capturing everything from quiet confidence to outright panic. For investors at any level, understanding the VIX can illuminate the broader market mood and help anticipate potential turning points, making it a valuable tool for strategic decision-making.
The VIX Meaning: Unpacking the Volatility Index

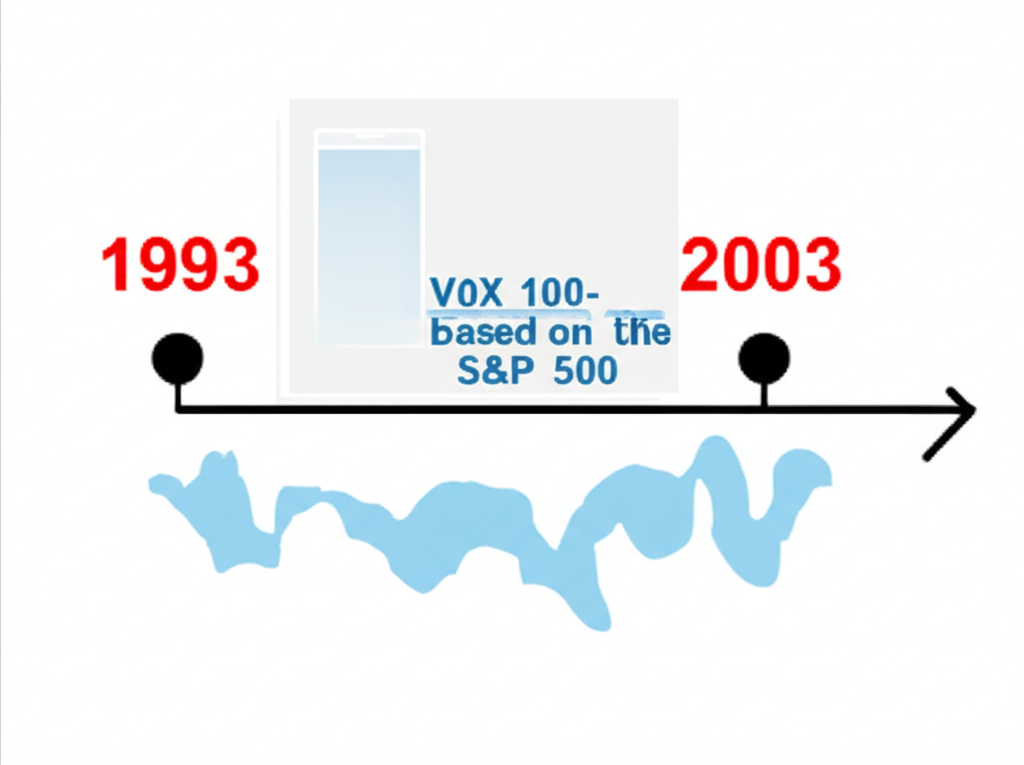
Launched by the Chicago Board Options Exchange (CBOE) in 1993, the VIX was originally based on the implied volatility of options tied to the S&P 100. While useful, this narrow focus limited its representativeness. A major update in 2003 shifted the index to track options on the S&P 500, a far broader and more accurate benchmark of the U.S. equity market. This change significantly enhanced the VIX’s relevance, allowing it to reflect the volatility expectations of a much larger segment of the economy. At its core, the VIX estimates the market’s forecast for 30-day volatility in the S&P 500, derived entirely from current options prices. Unlike traditional indicators that analyze past performance, the VIX looks ahead, offering a rare window into what traders collectively anticipate—making it indispensable for assessing future risk.
VIX: The Market’s “Fear Gauge”

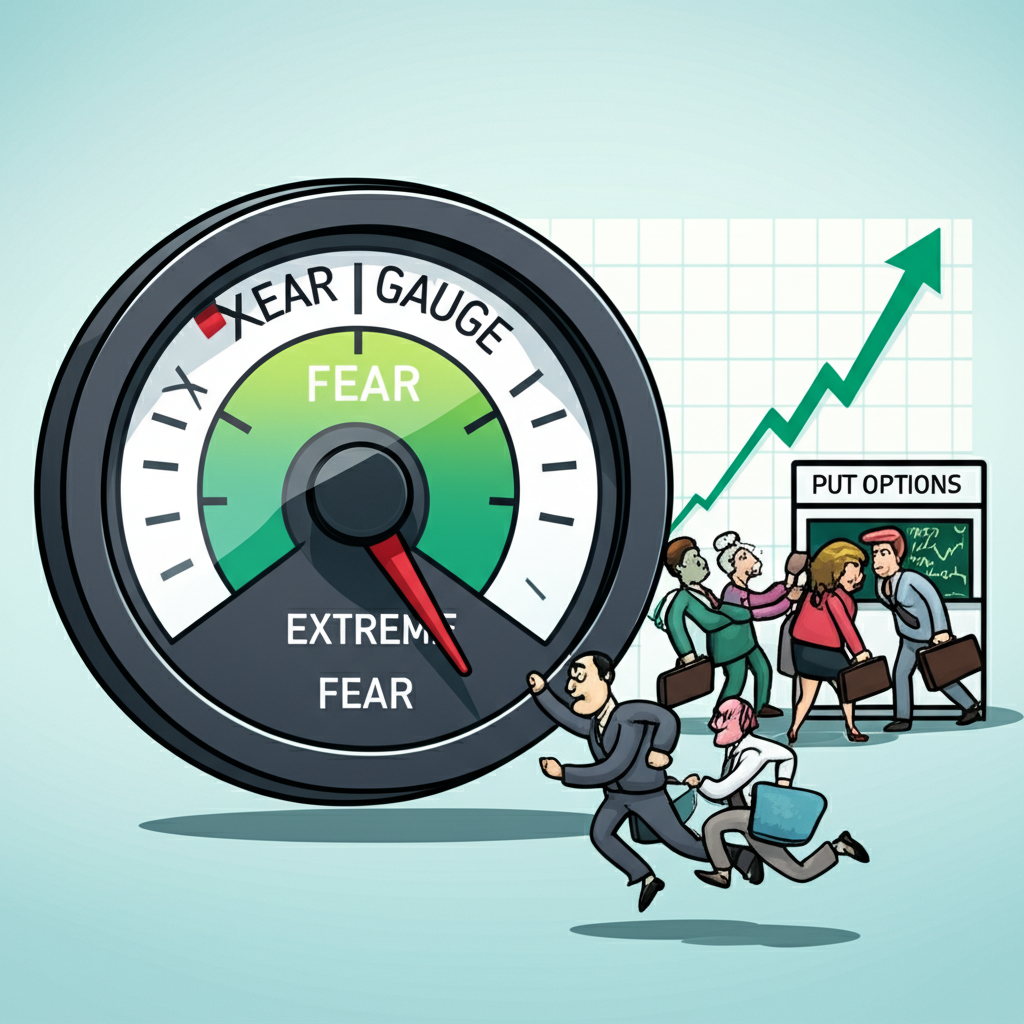
The nickname “fear index” isn’t just media flair—it’s rooted in observable market behavior. When uncertainty rises due to economic turmoil, geopolitical tensions, or sudden financial shocks, investors often seek protection. One of the most common ways to do this is by purchasing put options, which act as insurance against falling stock prices. As demand for these protective instruments increases, so do their prices. Since the VIX is derived from these very option prices, a surge in demand translates directly into a higher index value. On the flip side, when markets are stable and confidence is high, the need for protection diminishes. Traders become complacent, demand for puts drops, and the VIX declines. This dynamic creates a powerful inverse relationship between the VIX and stock market performance, turning the index into a reliable pulse check on investor sentiment.
How is the VIX Calculated? A Simplified Explanation

Understanding the mechanics behind the VIX helps demystify its significance. The index is built from the prices of a broad range of S&P 500 index options—both puts and calls—that expire between 23 and 37 days from the calculation date. These options are weighted according to their strike prices and time to expiration, with greater emphasis on those that are out-of-the-money, as they are more sensitive to changes in expected volatility. The key concept here is *implied volatility*—the market’s forecast of how much the S&P 500 might move in the future, inferred from the premiums traders are willing to pay for options. The CBOE aggregates this data across multiple strike prices and expiration dates, applying a sophisticated formula to distill it into a single number: the VIX. While the full methodology involves complex mathematics, the result is a straightforward indicator of expected market turbulence. For those interested in the technical details, the CBOE provides a comprehensive explanation on its website source.
Implied Volatility vs. Historical Volatility
It’s easy to confuse implied volatility with historical volatility, but they serve very different purposes. The distinction is crucial for interpreting the VIX correctly.
| Feature | Implied Volatility (VIX) | Historical Volatility |
|---|---|---|
| Nature | Forward-looking | Backward-looking |
| Basis | Derived from option prices; market expectations | Calculated from past price movements of an asset |
| Purpose | Gauges future expected fluctuations and market sentiment | Measures actual price swings that have already occurred |
| Application | Predictive indicator for potential market turbulence | Assessment of past risk and performance |
Historical volatility looks in the rearview mirror, measuring how much the S&P 500 actually moved over a specific period—say, the past 30 days. Implied volatility, represented by the VIX, peers into the future, estimating how much movement the market expects. This makes the VIX not just a volatility measure, but a sentiment barometer. When traders expect turbulence, implied volatility rises—even if prices haven’t moved yet.
Interpreting VIX Values: What Do the Numbers Mean?
Putting VIX numbers into context transforms raw data into actionable insight. While the index can fluctuate widely, certain thresholds have become widely recognized benchmarks among market participants.
| VIX Level | Interpretation | Market Sentiment |
|---|---|---|
| Below 15–20 | Low expected volatility | Complacency, optimism, “risk-on” environment |
| 20–30 | Moderate expected volatility | Increasing uncertainty, mild market jitters |
| Above 30–40+ | High expected volatility | Significant market fear, panic, often during sell-offs or crises |
A VIX reading around 15 suggests the market expects the S&P 500 to swing within a 15% annualized range over the next month—a sign of relative calm. Readings above 30 often accompany major downturns, signaling that traders are bracing for sharp moves. It’s worth noting that the VIX doesn’t stay at extreme highs for long; once panic subsides, it tends to revert toward its historical average, which often hovers between 15 and 20 during stable periods.
VIX and Market Behavior: Historical Context and Real-World Examples
The VIX has repeatedly proven its value as a real-time reflection of market stress. Its movements often mirror pivotal moments in financial history.
During the 2008 financial crisis, the VIX climbed to an intraday high of 89.53 on October 24, a record that still stands. This peak came amid collapsing financial institutions, government bailouts, and widespread investor panic. The S&P 500 plummeted, and the VIX surged in near-perfect inverse correlation, illustrating how fear can dominate market dynamics.
More recently, in March 2020, the outbreak of the COVID-19 pandemic triggered another dramatic spike. With economies shutting down overnight and markets reeling, the VIX reached 82.69 on March 16—its second-highest level on record. What made this event remarkable was the speed of the rise: the index jumped from the teens to the 80s in just a few weeks, underscoring how rapidly sentiment can shift when faced with global uncertainty.
Even smaller events—such as unexpected inflation reports, Federal Reserve decisions, or political instability—can push the VIX from the low 20s to the mid-30s. These patterns reinforce a well-documented trend: the VIX and the stock market typically move in opposite directions. When equities fall, volatility tends to rise, and vice versa.
Using the VIX in Your Investment Strategy (Beyond Trading)
While some investors trade VIX-related products directly, most can benefit from using the index as a strategic guide rather than a speculative tool.
* **Contrarian Signal with Caution**: A popular adage in finance is “When the VIX is high, it’s time to buy; when it’s low, it’s time to sell.” Extremely high VIX levels—especially above 40—often coincide with market bottoms, suggesting fear may have been overdone. These moments can present long-term buying opportunities for fundamentally strong assets. Conversely, a persistently low VIX (e.g., below 12) may signal excessive complacency, potentially warning of an upcoming correction. However, timing the market based solely on the VIX is risky and should be combined with other indicators and fundamental analysis.
* **Portfolio Hedging Tool**: Sophisticated investors and institutions sometimes use VIX futures or options to hedge against equity market declines. Because the VIX typically rises when the S&P 500 falls, adding a small position in VIX-linked instruments can help offset portfolio losses during downturns. However, this strategy involves complex risks, including contango in futures markets and time decay, making it unsuitable for most retail investors.
* **Risk Assessment Framework**: Perhaps the most practical use of the VIX is as a risk gauge. A rising VIX suggests growing uncertainty, prompting investors to reassess their exposure to volatile sectors or speculative holdings. For example, during a VIX spike, shifting toward defensive stocks, increasing cash reserves, or delaying major purchases might make sense. On the other hand, a stable, low VIX environment could justify taking on measured risk—but with awareness that calm periods can end abruptly.
Incorporating the VIX into a broader risk management framework can lead to more resilient portfolios. Many financial advisors emphasize its role in helping clients stay disciplined during emotional market swings source.
Common Misconceptions and Limitations of the VIX
Despite its reputation, the VIX is often misinterpreted. Recognizing its boundaries is essential for sound decision-making.
* **Not a Directional Forecast**: The VIX measures the expected magnitude of price swings, not their direction. A high reading means big moves are anticipated—but those could be up or down. While spikes usually occur during sell-offs, the index itself doesn’t predict whether the market will continue falling.
* **Not a One-Size-Fits-All Trading Tool**: Although exchange-traded products like VIX ETFs and ETNs exist, they track futures contracts, not the spot VIX. Due to the structure of futures markets—particularly contango and backwardation—these products can erode in value over time, even if the VIX remains stable. They are generally not suitable for long-term holding.
* **Short-Term Horizon**: The VIX is designed to reflect 30-day expectations. It offers little insight into long-term market trends, economic cycles, or structural shifts. Its value lies in near-term sentiment, not strategic forecasting.
* **Equity-Centric Scope**: The VIX is tied exclusively to the S&P 500. It does not measure volatility in bonds, commodities, international markets, or individual stocks outside the index. Investors with diversified portfolios should use it as one piece of a larger analytical puzzle.
Conclusion: The VIX as an Essential Tool for Informed Investors
The VIX Index remains one of the most insightful tools available for understanding market psychology and anticipated volatility. By distilling the collective expectations of options traders into a single, real-time number, it offers a unique vantage point on investor sentiment. While it doesn’t predict market direction or guarantee future outcomes, its ability to signal periods of fear or complacency adds a crucial dimension to investment analysis. Whether used as a contrarian indicator, a risk management reference, or a hedge planning tool, the VIX empowers investors to act with greater awareness. When combined with sound judgment and a diversified strategy, it can help navigate turbulent markets with more confidence and clarity.
What is the full form and meaning of VIX?
VIX stands for the Chicago Board Options Exchange (CBOE) Volatility Index. It is a real-time market index that represents the market’s expectation of 30-day forward-looking volatility for the S&P 500 Index.
How does the VIX reflect market sentiment or investor fear?
The VIX is often called the “fear index” because it tends to rise sharply during periods of market stress or uncertainty. This happens as investors buy more put options to hedge against potential losses, driving up option prices and, consequently, the VIX. A higher VIX indicates greater investor fear and expected volatility.
What does it mean when the VIX is high or low?
- High VIX (e.g., above 30-40): Signifies significant market fear, high expected volatility, and often occurs during sell-offs or crises.
- Low VIX (e.g., below 15-20): Indicates market complacency, low expected volatility, and typically a period of calm or bullish sentiment.
Can the VIX be used to predict stock market movements?
No, the VIX predicts expected *volatility* (the magnitude of price swings) not the *direction* of the market. While VIX spikes are historically associated with market downturns, it does not directly predict whether the market will go up or down, only that larger movements are anticipated.
How is the VIX calculated using S&P 500 options?
The VIX is calculated from the implied volatility of a wide range of S&P 500 index options that expire between 23 and 37 days in the future. It aggregates the weighted prices of various out-of-the-money put and call options to derive a single value representing the market’s expectation of future volatility.
What is a historically “normal” range for the VIX?
Historically, the VIX has often traded in the 15-20 range during periods of relative market calm. However, “normal” can fluctuate with economic cycles and market conditions. Values consistently below 15 are considered low, while sustained periods above 20 often indicate heightened uncertainty.
Are there ways for individual investors to trade the VIX?
Yes, individual investors can gain exposure to VIX through VIX futures, VIX options, and exchange-traded products (ETPs) like ETFs and ETNs that track VIX futures. However, direct VIX trading is highly complex due to factors like contango, backwardation, and time decay, and it is generally not recommended for average investors without advanced knowledge.
What are the main limitations of using the VIX as an investment tool?
The main limitations include:
- It only measures expected volatility, not market direction.
- It has a short-term, 30-day forward-looking focus.
- It specifically reflects S&P 500 volatility, not the entire market or other asset classes.
- Direct trading of VIX products is complex and carries significant risks.
How does VIX differ from other measures of market volatility?
The key difference is that VIX measures *implied volatility*, which is forward-looking and based on market expectations derived from option prices. Other measures, like historical volatility, are backward-looking and simply calculate how much an asset’s price has fluctuated in the past. This makes VIX unique in its ability to gauge future sentiment.
What usually happens to the stock market when the VIX spikes?
When the VIX spikes, it usually indicates a sharp increase in investor fear and expected volatility. Historically, VIX spikes are often accompanied by significant downturns or corrections in the stock market (especially the S&P 500), as investors rush to sell assets or hedge their portfolios.
You may also like
Calendar
| 一 | 二 | 三 | 四 | 五 | 六 | 日 |
|---|---|---|---|---|---|---|
| 1 | 2 | 3 | 4 | 5 | 6 | 7 |
| 8 | 9 | 10 | 11 | 12 | 13 | 14 |
| 15 | 16 | 17 | 18 | 19 | 20 | 21 |
| 22 | 23 | 24 | 25 | 26 | 27 | 28 |
| 29 | 30 | 31 | ||||
發佈留言
很抱歉,必須登入網站才能發佈留言。