
VIX Oil: Unraveling the Secrets of Volatility in Financial Markets
Decoding Market Signals: Understanding VIX and Crude Oil Volatility (OVX)
Welcome! Today, we’re going to delve into a crucial aspect of financial markets: volatility. Think of volatility not just as random noise, but as a key signal, a kind of market weather forecast telling us about potential storms or calm skies ahead. For investors and traders, understanding volatility isn’t just academic; it’s essential for managing risk, identifying potential opportunities, and making informed decisions.
When we talk about market volatility, two indices often come to mind: the VIX, which measures expected volatility in the stock market, and the Crude Oil VIX (OVX), its counterpart for the energy sector. These indices are more than just numbers; they are barometers reflecting collective market sentiment, influenced by everything from economic data releases and central bank pronouncements to geopolitical developments.
In this comprehensive guide, we will break down what the VIX and OVX are, how they are calculated, what their movements signal, and perhaps most importantly, how major global forces like inflation, interest rates, and geopolitical events directly impact these measures. By the end, you should have a much clearer picture of how volatility works and how you can potentially use this knowledge in your own market activities.
So, let’s begin our journey into the heart of market turbulence and learn how to read the signals it provides.
VIX: The Pulse of Stock Market Fear
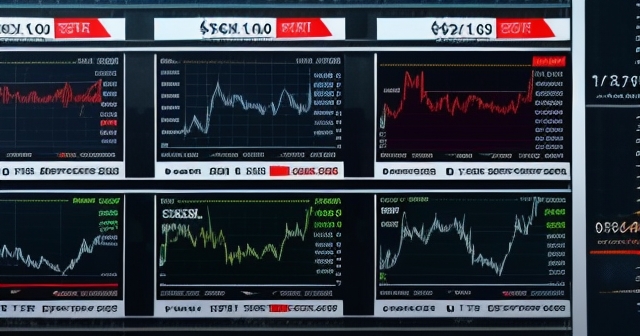
Let’s start with the granddaddy of volatility indices: the VIX, officially known as the CBOE Market Volatility Index. Created by the Chicago Board Options Exchange (CBOE), the VIX is often referred to as the “fear gauge” of the stock market. Why fear? Because it reflects the market’s expectation of near-term volatility based on options prices for the S&P 500 index (SPX).
How does it work? The VIX doesn’t measure historical price swings; instead, it looks forward. Specifically, it calculates the expected volatility of the S&P 500 over the next 30 days by analyzing the prices of a wide range of SPX put and call options that expire in that period. The prices of these options already contain embedded information about market expectations. When investors expect larger price swings (up or down), they are willing to pay more for options, especially out-of-the-money options, because there’s a higher perceived chance those options will become profitable. Higher option prices, in turn, push the VIX value higher.
Imagine you are planning a trip. The VIX is like a sophisticated weather model predicting how choppy the seas will be over the next month, based on current atmospheric conditions and forecasts. It doesn’t tell you where the market will go, only how rough the ride might be expected to be. A high VIX suggests markets expect significant price swings, which can often correlate with periods of uncertainty or fear, while a low VIX indicates expectations of calmer, less volatile conditions.
This forward-looking nature is what makes the VIX so valuable. It’s not a lagging indicator showing what already happened; it’s a real-time reflection of how market participants collectively perceive the potential for future market turbulence based on their trading actions in the options market.
Interpreting VIX Levels: What the Numbers Tell Us
Understanding the VIX’s definition is one thing, but learning to interpret its levels is where the real insight lies. The VIX doesn’t trade in points like a stock index; it represents an annualized expected percentage range of movement over the next 30 days, though it’s usually discussed simply as a number.
Historically, VIX levels below 20 have been associated with periods of relative market calm or bullish sentiment. When the VIX is in the low teens, as it sometimes is (we’ve seen levels as low as 10.62 in recent 52-week ranges), it suggests market participants aren’t anticipating large, sudden moves. Trading might be less frantic, and trending moves might be smoother.
Levels above 20 typically signal heightened uncertainty. A VIX above 30 is often considered a sign of significant market stress or fear. During major crises, such as the 2008 financial crisis or the initial stages of the COVID-19 pandemic, the VIX has spiked dramatically, reaching levels well over 60, and at one point, within the last 52 weeks, hitting 65.73. These spikes indicate market participants are bracing for massive, potentially disruptive price swings.
For instance, data around February 13, 2025, showed VIX levels fluctuating, with some measures pointing towards a range in the 28-38 area. This range would suggest a market environment where expectations for volatility were significantly elevated compared to historically calm periods below 20. Such levels might coincide with major economic announcements, central bank meetings, or unfolding geopolitical events.
So, when you see the VIX rising, the market is collectively signaling that it expects bigger moves soon. This doesn’t necessarily mean the market will go down; high volatility means big moves in *either* direction are considered more likely. However, sharp spikes in the VIX are often associated with rapid market declines, as fear can lead to panic selling, which in turn increases expected future volatility.
Introducing the Crude Oil VIX (OVX): Volatility in Energy Markets
While the VIX focuses on the broad stock market (specifically the S&P 500), volatility is not confined to equities. Commodities, currencies, and bonds all have their own dynamics of expected price swings. For crude oil, a vital global commodity, we have a dedicated index: the Crude Oil VIX, or OVX.
Just like the VIX for stocks, the OVX is calculated by the CBOE. However, instead of using S&P 500 options, the OVX uses the prices of options on United States Oil Fund, LP (USO). USO is an exchange-traded fund (ETF) designed to track the price movements of West Texas Intermediate (WTI) light sweet crude oil. By analyzing the implied volatility of a range of near-term put and call options on USO, the OVX provides a 30-day expectation of volatility specifically for crude oil prices.
Why is a specific volatility index for oil important? Crude oil is a cornerstone of the global economy. Its price fluctuations impact everything from transportation costs and manufacturing expenses to inflation expectations. Volatility in oil prices can be driven by unique factors, such as OPEC production decisions, inventory levels, geopolitical tensions in oil-producing regions, or shifts in global demand forecasts, in addition to broader market sentiment.
For example, data from April 5, 2024, showed the OVX at 32.36. An OVX level in this range suggests that market participants expected relatively significant price swings in crude oil over the following month. This could be due to concerns about supply disruptions, uncertainty regarding future demand, or reactions to recent price movements.
For traders and analysts focused on the energy sector, the OVX is an indispensable tool. It offers a forward-looking view of potential price turbulence in crude oil, allowing them to better assess risk and potential opportunities in this specific market.
Comparing VIX and OVX: Similarities and Key Differences
Both the VIX and the OVX are CBOE volatility indices, calculated using implied volatility derived from options prices to forecast expected price swings over the next 30 days. In that fundamental sense, they are similar barometers of market expectation, just applied to different underlying assets.
However, the differences are crucial and highlight why we need both.
- Underlying Asset: VIX is based on the S&P 500 stock index. OVX is based on crude oil futures (via the USO ETF options). This is the most significant difference, as they track expected volatility in fundamentally different markets.
- Drivers: While both can be influenced by broad macroeconomic trends and overall risk sentiment, they also respond to unique factors. VIX is heavily influenced by factors affecting corporate earnings, equity valuations, and systemic financial risk. OVX is primarily driven by factors specific to the supply and demand dynamics of crude oil, such as production cuts, inventory reports, refinery issues, and energy-specific geopolitical events.
- Correlation: VIX and OVX often show positive correlation, particularly during periods of broad market stress. When there is widespread risk aversion, both stock and commodity markets can become more volatile. However, they can and do diverge. For instance, a geopolitical event impacting oil supply might cause a sharp spike in OVX while the VIX remains relatively subdued if the event is not perceived as a major threat to the broader equity market, or vice versa.
Think of VIX as the overall turbulence indicator for a commercial airline flight (the stock market), while OVX is the turbulence indicator specifically for a cargo plane carrying oil barrels. Both might experience turbulence during a major storm (macro crisis), but the cargo plane might also hit specific rough patches related to its unique cargo or route (oil-specific factors) that the passenger plane avoids, and vice-versa.
Understanding both indices gives you a more nuanced view of market expectations. A high VIX with a relatively low OVX might suggest equity-specific concerns, while a spiking OVX with a stable VIX could point to risks primarily confined to the energy sector.
The Macro Connection: How Inflation and Interest Rates Fuel Volatility
Now, let’s connect these volatility indices to the big picture – the macroeconomic landscape. You’ve heard about inflation and interest rates constantly in the news, and for good reason. These factors are powerful drivers of market volatility, directly influencing the expectations reflected in VIX and OVX.
Inflation: When inflation is high and persistent (“hot inflation data”), it creates uncertainty about several things.
- First, it erodes purchasing power, potentially slowing consumer spending and impacting corporate profits.
- Second, and critically for volatility, it signals that central banks, like the Federal Reserve in the US, are likely to take action to control it.
Interest Rates: Central banks primarily use interest rates as their tool to fight inflation. Raising interest rates makes borrowing more expensive, which can slow down economic activity, cool demand, and theoretically bring inflation down. However, raising rates too much or too quickly can risk triggering a recession.
This creates a delicate balance and a source of significant market uncertainty. When new inflation data is released, especially if it’s hotter than expected (like the “hot US inflation data” mentioned in the summary), market participants immediately adjust their expectations about how aggressive the central bank will be with rate hikes or how many rate cuts they might implement in the future. If the data suggests fewer rate cuts or potential for more hikes, it can lead to sharp market shifts. Why? Because higher interest rates can reduce the present value of future corporate earnings, impacting stock valuations (driving VIX) and increasing borrowing costs for energy companies or impacting demand for oil (driving OVX).
Periods leading up to and immediately following major inflation reports or central bank meetings (like those involving Jerome Powell or the Bank of England) are often marked by elevated volatility, precisely because the market is highly sensitive to how these data points will influence monetary policy expectations. The uncertainty about future rates translates directly into uncertainty about future asset prices, which is what volatility indices measure.
Central Banks in Focus: Navigating Policy-Driven Swings
Building on the macro connection, let’s focus specifically on the role of central banks. These institutions are the architects of monetary policy, and their decisions and even their forward guidance can send significant ripples through financial markets, profoundly impacting volatility.
The Federal Reserve (Fed) in the United States is arguably the most influential central bank globally. Its stance on interest rates, its commentary on the economy, and its quantitative easing/tightening programs are watched closely by markets worldwide. When Fed officials speak, or when the Federal Open Market Committee (FOMC) releases its policy statement and economic projections, market expectations about future rates can shift dramatically.
Consider the impact of signals regarding “fewer rate cuts.” If the market was previously anticipating several rate cuts within a certain timeframe, and then the Fed signals that inflation is still too sticky or the economy is too strong to warrant rapid cuts, investors adjust their models. This recalibration can lead to repricing across asset classes – stocks, bonds, currencies, and commodities. This repricing process is often accompanied by increased volatility, reflected in a higher VIX.
Similarly, other central banks, such as the Bank of England (BoE) or the European Central Bank (ECB), influence volatility within their respective regions and, to some extent, globally, given the interconnectedness of financial markets. Expectations around BoE policy, for instance, would impact UK market volatility (affecting indices like the FTSE 100) and can spill over into global sentiment.
The key takeaway here is that central banks, through their actions and communication, directly shape the economic outlook and the cost of capital. Uncertainty or unexpected changes in their policy path are major catalysts for increased market volatility as participants scramble to adjust their portfolios to the new reality.
Geopolitical Ripples: Global Events and Market Uncertainty
Beyond macroeconomic data and central bank policies, the world of geopolitics is another significant source of market volatility. Events happening far away can have immediate and profound impacts on financial markets, boosting indices like the VIX and OVX.
Why? Geopolitical events introduce uncertainty that is often difficult to quantify. Unlike an inflation report, which is a specific number, the outcome and duration of geopolitical conflicts or trade disputes are inherently unpredictable. This lack of clarity makes investors nervous, leading to increased hedging activity and a greater demand for options as a way to protect portfolios. This increased demand drives up option prices, pushing volatility indices higher.
Consider the mention of Ukraine talks or tariff discussions in the provided data context. The ongoing situation in Ukraine has had a direct impact on energy markets, disrupting supply chains and influencing the price of oil and gas. Uncertainty surrounding peace talks or potential escalations immediately affects expectations about future energy supply and demand, leading to higher volatility in crude oil prices and, consequently, a higher OVX.
Similarly, discussions around trade tariffs can impact global supply chains, corporate profitability (especially for multinational companies), and economic growth forecasts. The uncertainty over whether new tariffs will be imposed, who will be affected, and what the retaliatory measures might be creates ripples of anxiety throughout equity markets, contributing to higher VIX levels.
Geopolitical risks are often the most abrupt catalysts for volatility spikes. They can emerge quickly and their resolution is rarely straightforward, making them a constant, if sometimes latent, factor influencing market sentiment and expected price swings.
The Role of Options and Derivatives in Volatility
To truly understand the VIX and OVX, we need to touch upon the instruments from which they are derived: options and other derivatives. As we mentioned, VIX and OVX are calculated using the prices of options on their respective underlying assets (S&P 500 index for VIX, USO ETF for OVX).
The key concept here is Implied Volatility (IV). While historical volatility measures how much an asset’s price has swung in the past, implied volatility is forward-looking. It’s the market’s estimate of future volatility, baked into the current prices of options contracts. Option pricing models (like the Black-Scholes model) use implied volatility as a key input. If the market expects more volatility, option buyers are willing to pay more, and option sellers demand more, driving up the price of the option contract. Working backward from the option price using a pricing model gives us the implied volatility.
VIX and OVX essentially aggregate the implied volatilities from a wide range of options contracts across different strike prices and expirations to create a single, weighted index representing expected volatility over a standard 30-day period.
Furthermore, large-scale events in the derivatives market can sometimes mechanically increase volatility. One notable example is Triple Witching, which occurs four times a year when stock options, stock index options, and stock index futures all expire on the same day. This simultaneous expiration can lead to massive trading volumes as participants close or roll over positions, potentially causing significant price swings in the underlying assets as positions are unwound or re-established.
Understanding implied volatility is crucial for anyone trading options, but it also provides valuable context for understanding VIX and OVX. A rising IV or VIX/OVX suggests that the options market is pricing in larger potential moves, often signaling increased uncertainty or anticipation of a major event. Conversely, falling IV or VIX/OVX suggests expectations for calmer markets.
Using Volatility Indices in Your Trading Strategy
So, how can you, as an investor or trader, use the information provided by indices like VIX and OVX? They are not directly tradable indices themselves, but there are various ways to incorporate volatility insights into your approach, particularly if you engage in options trading or derivative-based strategies.
Firstly, VIX and OVX can serve as crucial risk management tools. A rising VIX might signal that now is a time to reduce overall portfolio risk, hedge positions (perhaps by buying put options, which would likely be more expensive as VIX rises), or simply hold more cash. Similarly, a high OVX indicates elevated risk in the crude oil market, perhaps cautioning against large directional bets or suggesting the use of strategies designed for high volatility environments.
Secondly, they can help identify potential trading opportunities. While high volatility periods are risky, they also often coincide with significant price movements, which can present opportunities for traders who are prepared. Some strategies are specifically designed to profit from changes in volatility levels (e.g., selling options during periods of extremely high implied volatility, assuming volatility will mean-revert). However, these strategies often carry significant risk and are best suited for experienced traders.
For those considering exploring various markets, including currencies and commodities, and utilizing instruments like CFDs or options, the choice of a trading platform is key. A platform that offers a wide range of markets and robust tools can be very helpful.
For instance, if you’re considering engaging in options strategies or exploring CFDs on various instruments, including indices and commodities, a platform offering diverse instruments and reliable execution is important.
Volatility indices can also act as confirming or contra-indicators. For example, a market rally accompanied by a rising VIX might be viewed with suspicion, as it suggests underlying fear persists despite rising prices (a potentially unstable situation). Conversely, a market decline on falling VIX could indicate that the selling is less driven by panic and more by re-positioning, which might signal a nearing bottom.
If you’re looking for a platform that supports trading across a broad spectrum of instruments, including forex and various CFDs, and provides access to established trading interfaces like MT4 and MT5, then finding a well-regulated broker is essential for peace of mind and effective execution.
Navigating the Complex Landscape: Putting it All Together
As we’ve explored, market volatility, as measured by indices like the VIX and OVX, is not a simple phenomenon. It is a complex interplay of factors, from the immediate forces of supply and demand in specific markets (like oil) to the overarching influences of global macroeconomics and unpredictable geopolitical events.
Understanding the components of volatility means recognizing that:
- VIX is the market’s expectation of S&P 500 volatility, heavily influenced by broad risk sentiment and macroeconomic policy.
- OVX is the market’s expectation of crude oil volatility, driven by energy-specific factors as well as overall market sentiment.
- Both are forward-looking, based on the implied volatility of options.
- Inflation, interest rates, central bank actions, and geopolitical events are key catalysts that can cause VIX and OVX to spike, indicating higher expected turbulence.
For you as an investor or trader, this knowledge is power. It helps you contextualize market movements. A sudden drop in the S&P 500 isn’t just a drop; if it’s accompanied by a VIX spike, it tells you that panic or significant uncertainty is driving the move and markets expect more choppiness ahead. Likewise, a surge in oil prices alongside a jump in OVX suggests that the rally is accompanied by heightened risk and uncertainty in the energy market.
While managing risk is paramount in volatile times, volatility also creates dispersion in prices, potentially leading to opportunities for those who have a clear strategy and understand the underlying drivers. Staying informed about macroeconomic developments, central bank communications, and geopolitical events is crucial for anticipating potential shifts in market volatility.
Navigating financial markets requires continuous learning and adaptation. By understanding the signals sent by volatility indices like the VIX and OVX, you gain a deeper insight into the collective mindset of the market and are better equipped to make decisions in an ever-changing financial landscape.
If you are looking to expand your trading activities into different asset classes like forex, commodities, and indices via platforms that offer various trading instruments, it is wise to consider well-established brokers. Choosing a platform that combines a wide range of offerings with strong regulatory oversight can provide a solid foundation for your trading journey.
If you’re considering starting forex trading or exploring more CFD instruments, then Moneta Markets is a platform worth looking into. It’s based in Australia and provides over 1000 financial instruments, suitable for both beginners and professional traders.
| Volatility Index | Underlying Asset | Expected Move Duration |
|---|---|---|
| VIX | S&P 500 Index | 30 Days |
| OVX | Crude Oil (USO ETF) | 30 Days |
| Volatility Level | Market Sentiment |
|---|---|
| Below 20 | Relative Calm, Bullish Sentiment |
| 20-30 | Increased Uncertainty |
| Above 30 | Significant Market Stress or Fear |
| Driver | Impact on VIX | Impact on OVX |
|---|---|---|
| Inflation Data | Increases Uncertainty | Can Drive Oil Price Fluctuations |
| Interest Rates | Affects Corporate Valuations | Influences Demand for Energy |
| Geopolitical Events | Can Spike Market Volatility | Increases Oil Price Uncertainty |
vix oilFAQ
Q:What does VIX measure?
A:VIX measures expected volatility in the stock market based on options prices for the S&P 500 index.
Q:How is OVX different from VIX?
A:OVX measures expected volatility for crude oil, specifically using prices of options on the USO ETF.
Q:What do high levels of VIX or OVX indicate?
A:High levels indicate increased expectations for market volatility, often associated with fear or uncertainty.
發佈留言
很抱歉,必須登入網站才能發佈留言。