
WTI Charts: Unlocking Crude Oil Market Insights for Smarter Trading
Introduction to WTI Crude Oil Charts

West Texas Intermediate (WTI) crude oil is more than just a grade of petroleum—it’s a cornerstone of the global energy landscape. As the primary benchmark for oil pricing in North America, WTI influences everything from fuel costs at the pump to corporate balance sheets in the energy sector. For traders, investors, and analysts, understanding WTI crude oil charts is essential. These visual tools capture the rhythm of price fluctuations across different timeframes, revealing insights into market psychology, supply-demand shifts, and the ripple effects of geopolitical developments. This guide offers a comprehensive exploration of WTI crude oil—from its definition and market significance to how live and historical charts are interpreted. We’ll also examine the forces shaping its value and how both technical and fundamental analysis can be applied to make smarter, data-driven decisions in volatile energy markets.
Understanding WTI Crude Oil: The Benchmark Explained
What is West Texas Intermediate (WTI)?
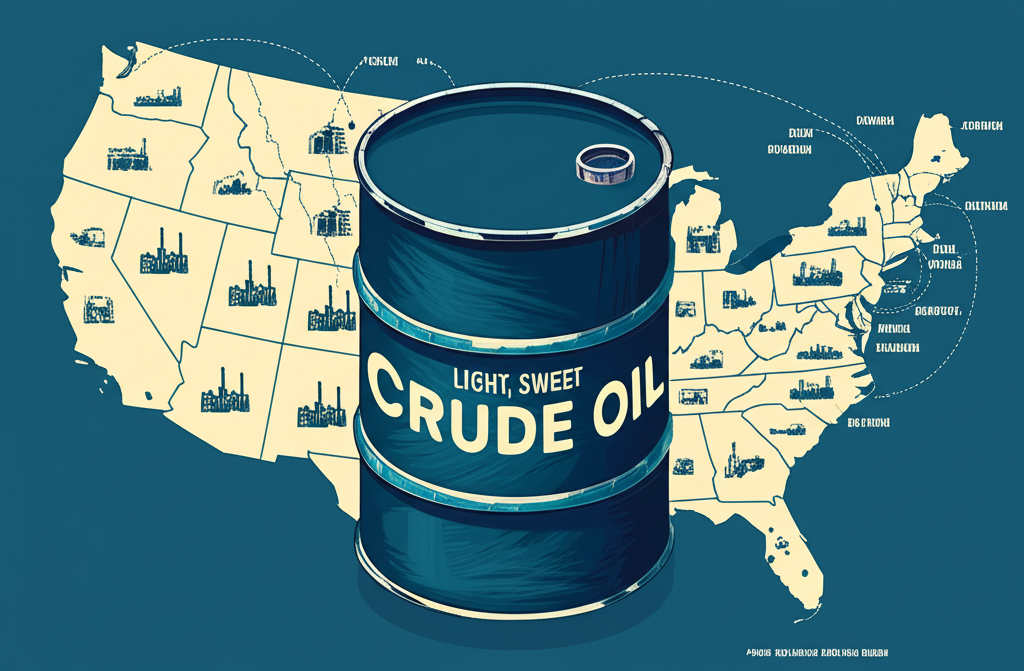
West Texas Intermediate, or WTI, is widely recognized as one of the highest-quality crude oils in the world. Classified as a “light, sweet” crude, it has a low density and minimal sulfur content—making it easier and more cost-effective to refine into high-demand products such as gasoline, diesel, and jet fuel. Most WTI crude is extracted from oil fields across the United States, including key regions like Texas, North Dakota, and the Gulf Coast. The oil is then transported via an extensive pipeline network to Cushing, Oklahoma, a critical logistics and storage hub. This inland location serves as the official delivery point for WTI futures contracts traded on the New York Mercantile Exchange (NYMEX). Because of its physical and financial centrality, the inventory levels and flow dynamics in Cushing directly influence WTI’s spot price. As a result, WTI isn’t just a commodity—it’s a real-time barometer of U.S. energy market health and a global reference point for oil valuation.
WTI vs. Brent Crude: Key Differences and Market Impact
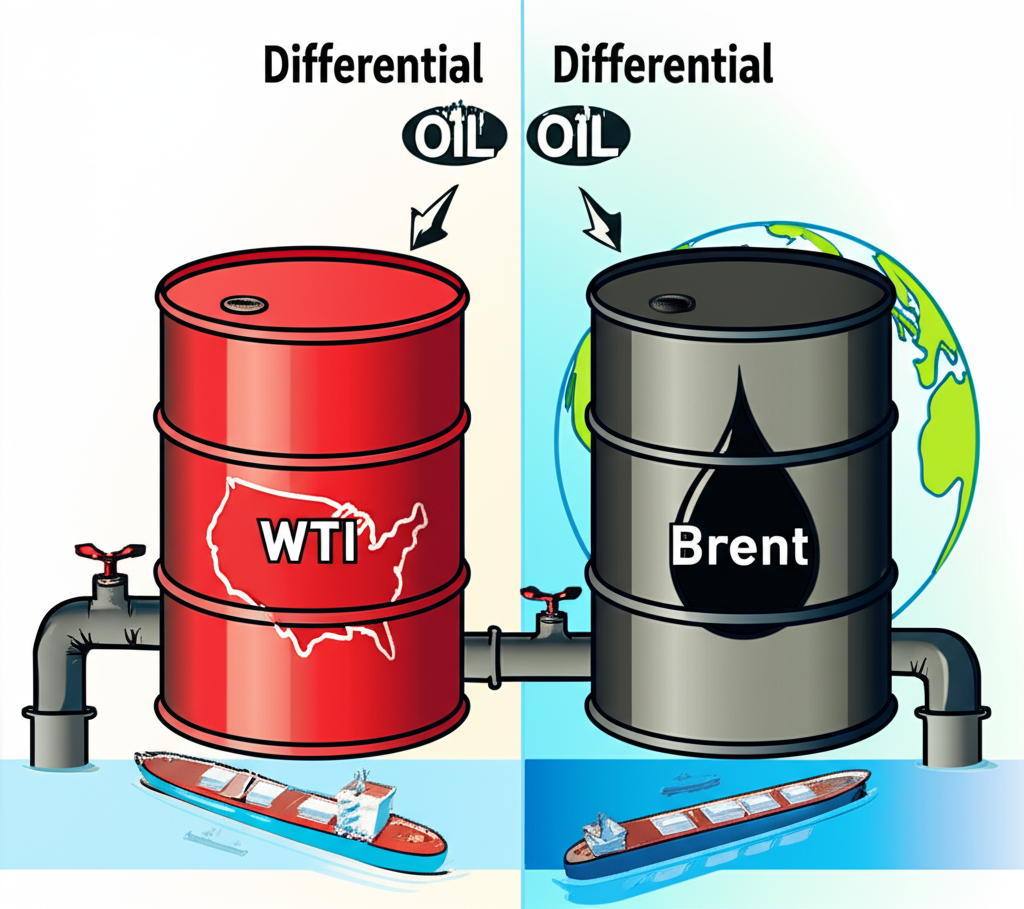
While WTI dominates the North American market, Brent crude holds sway over global oil pricing. Brent serves as the benchmark for roughly two-thirds of internationally traded crude oil, especially in Europe, Africa, and the Middle East. Though both are light and sweet, subtle differences in quality, origin, and logistics create distinct market behaviors and occasional price divergences.
| Feature | WTI (West Texas Intermediate) | Brent Crude |
|---|---|---|
| Origin | Primarily U.S. oil fields (e.g., Texas, Louisiana, North Dakota). Delivered to Cushing, Oklahoma. | North Sea oil fields (e.g., Brent, Forties, Oseberg, Ekofisk). Delivered via pipeline and tanker. |
| Quality | “Light, Sweet” (API gravity ~39.6°, sulfur content ~0.24%). Generally considered higher quality. | “Light, Sweet” (API gravity ~38°, sulfur content ~0.37%). Slightly heavier and more sulfurous than WTI. |
| Market | North American benchmark, priced in Cushing, Oklahoma. Futures traded on NYMEX. | Global benchmark, widely used for pricing two-thirds of the world’s internationally traded crude oil. Futures traded on ICE Futures Europe. |
| Transportation | Primarily pipeline-dependent to reach refineries. | Primarily sea-borne, making it more accessible to global markets. |
| Price Differential | Historically, WTI often traded at a discount to Brent due to infrastructure bottlenecks in the U.S. More recently, this has fluctuated, with WTI sometimes trading at a premium. | Often trades at a premium to WTI, reflecting global accessibility and demand. |
The gap between WTI and Brent prices, known as the “spread,” is a powerful indicator of regional supply constraints and logistical challenges. For example, when U.S. pipeline capacity is strained or storage in Cushing fills up, WTI may weaken relative to Brent. Conversely, strong domestic demand or increased U.S. crude exports can narrow or even reverse the spread. Traders and analysts closely monitor this relationship not only as a risk signal but also for potential arbitrage opportunities—buying cheaper crude in one market while selling the more expensive equivalent elsewhere.
Live WTI Charts: How to Access Real-Time Price Data
Key Features of Live WTI Charts
Live WTI charts are indispensable for anyone tracking the pulse of the oil market. These dynamic displays update in real time, reflecting the latest bids, offers, and executed trades. Available through financial data platforms and trading interfaces, they allow users to monitor price action as it unfolds—crucial for making timely decisions in a fast-moving commodity market.
Most live WTI charts come equipped with customizable features that cater to different analytical needs:
- Timeframes: Whether you’re a day trader watching 1-minute candles or a strategist analyzing daily trends, the ability to switch between time intervals—from tick data to monthly bars—provides flexibility across trading styles.
- Chart Types: Candlestick charts remain a favorite for their ability to show open, high, low, and close prices within a single bar. Line charts simplify long-term trends, while bar charts offer a clean view of price ranges. Each format serves a specific purpose in market analysis.
- Indicators: Built-in tools like Moving Averages (MA), Relative Strength Index (RSI), MACD, and Bollinger Bands help traders identify momentum, trend strength, and potential reversal zones. These overlays transform raw price data into actionable signals.
Trusted platforms such as TradingView and Investing.com offer user-friendly interfaces with advanced charting capabilities. Financial giants like Bloomberg and Reuters also provide institutional-grade data, often integrated with news feeds and economic calendars for real-time context.
Reading WTI Futures Contracts (NYMEX: CL)
The most common way to trade WTI crude oil is through futures contracts on the New York Mercantile Exchange (NYMEX), part of the CME Group. These contracts commit buyers and sellers to exchange a set quantity of oil—1,000 barrels—at a predetermined price on a future date. The standard ticker symbol for WTI futures is “CL,” followed by a code indicating the contract’s expiration.
The expiration month is denoted by a single letter:
- F: January
- G: February
- H: March
- J: April
- K: May
- M: June
- N: July
- Q: August
- U: September
- V: October
- X: November
- Z: December
For example, “CLG24” refers to the WTI futures contract expiring in February 2024. Traders must be aware of contract rollover dates, as liquidity typically shifts to the next active contract before expiration. Additionally, the structure of futures prices—whether in contango (futures priced above spot) or backwardation (futures below spot)—can reveal market expectations about supply availability and storage costs, particularly at Cushing.
Historical WTI Price Charts: Analyzing Past Trends
Accessing Long-Term WTI Data
While real-time charts are vital for short-term trading, historical WTI price data offers a broader perspective. Studying past price movements helps identify recurring patterns, assess market cycles, and contextualize current volatility. For analysts and investors, long-term charts are a window into the structural shifts shaping the oil industry.
Reliable sources for historical WTI data include:
- The U.S. Energy Information Administration (EIA), which maintains extensive records on crude oil prices, production, imports, and inventories.
- Financial data platforms like Macrotrends and Yahoo Finance, which offer downloadable historical price series in daily, weekly, or monthly formats—ideal for backtesting strategies or conducting macroeconomic research.
When analyzing different time horizons, the insights vary significantly:
- 1-Year Charts: Highlight recent support and resistance levels, short-term trends, and the immediate impact of economic reports or geopolitical events.
- 5-Year Charts: Reveal medium-term cycles, helping to distinguish between temporary fluctuations and sustained market shifts—such as the recovery from the 2020 pandemic crash.
- 10-Year Charts: Provide a macroeconomic narrative, illustrating how technological breakthroughs (like the shale boom), financial crises, and long-running geopolitical tensions have shaped WTI’s trajectory over time.
Major Historical Events and Their Impact on WTI Prices
WTI price charts often mirror the timeline of modern global history. Each major crisis or turning point leaves a visible mark on the data:
- 2008 Financial Crisis: After peaking above $140 per barrel in July 2008, WTI collapsed to under $40 by early 2009 as global demand evaporated amid widespread economic contraction.
- 2014–2016 Oil Price Crash: A flood of U.S. shale production, combined with OPEC’s decision to maintain output, triggered a prolonged downturn. WTI fell from over $100 to below $30, severely impacting energy companies and oil-dependent economies.
- 2020 Oil Price Crash (COVID-19 Pandemic): The most unprecedented event in oil market history occurred in April 2020, when WTI futures briefly traded at negative $40 per barrel. With demand nearly halted and storage at Cushing nearing capacity, sellers paid buyers to take oil off their hands—a stark reminder of the physical constraints in commodity markets.
- Geopolitical Conflicts: Wars in the Persian Gulf (1990–1991), Iraq (2003), and ongoing tensions in the Middle East have repeatedly caused sharp spikes in WTI prices due to fears of supply disruptions. Even saber-rattling or sanctions can trigger volatility, as markets price in potential risks.
These episodes underscore the sensitivity of oil prices to both tangible imbalances and psychological factors. Historical charts not only document these events but also serve as reference points for understanding future market behavior.
Factors Influencing WTI Crude Oil Prices
Supply and Demand Dynamics
At its core, WTI pricing is governed by the balance between global oil supply and demand. Even small shifts in either can trigger significant price movements.
- Supply: Production levels from major players like OPEC+, the United States (particularly shale producers), Russia, and Canada play a decisive role. Disruptions—whether from geopolitical conflict, hurricanes, or technical outages—can tighten supply. Equally important are inventory levels, tracked weekly by the EIA Weekly Petroleum Status Report and the American Petroleum Institute (API). Rising inventories often signal oversupply and downward pressure on prices, while draws suggest tightening conditions.
- Demand: Global economic growth is the primary engine of oil consumption. Industrial output, transportation activity, and consumer spending all drive demand. Recessions, pandemics, or long-term shifts toward renewable energy can erode demand, as seen during the early stages of the energy transition.
Geopolitical Events and Market Sentiment
Oil markets are inherently sensitive to geopolitical risk. Conflicts in key producing regions—such as the Middle East, Venezuela, or the Black Sea—can disrupt supply chains and trigger panic buying. Sanctions, trade restrictions, or political instability also feed into market sentiment, often causing prices to react before any actual physical disruption occurs. Traders closely monitor news from these regions, knowing that even rumors can move markets. This emotional layer amplifies price swings, making oil one of the most reactive commodities to global headlines.
Economic Indicators and Currency Fluctuations
The health of the global economy has a direct bearing on WTI prices:
- Global GDP Growth: Strong economic expansion correlates with higher industrial activity and transportation needs, boosting oil demand.
- Inflation and Interest Rates: In periods of high inflation, commodities like oil are often seen as inflation hedges, supporting prices. However, aggressive interest rate hikes by central banks—aimed at cooling inflation—can slow economic growth and reduce oil consumption.
- US Dollar Strength: Since WTI is priced in U.S. dollars, the currency’s value plays a critical role. A stronger dollar makes oil more expensive for foreign buyers, potentially reducing demand and pressuring prices downward. Conversely, a weaker dollar enhances affordability, often lifting crude prices.
The Role of Speculation and Futures Trading
Beyond physical fundamentals, the futures market itself shapes WTI prices. Speculative activity by hedge funds, institutional investors, and algorithmic traders can drive short-term volatility. When large volumes of futures contracts are bought or sold based on price expectations, the market can move independently of immediate supply-demand realities. At the same time, hedging by oil producers and refiners—locking in prices to manage risk—adds depth and structure to the market. The interaction between speculation and hedging influences the shape of the futures curve, whether in contango or backwardation, and affects pricing across different contract maturities.
Advanced Analysis: Interpreting WTI Charts for Strategic Decisions
Common Technical Analysis Patterns in Oil Markets
Technical analysis is a powerful tool for forecasting WTI price movements by identifying recurring patterns and momentum signals. Traders use these patterns to anticipate reversals, continuations, and breakout opportunities.
- Head and Shoulders: This classic reversal pattern features three peaks—the middle one (the head) higher than the two sides (the shoulders). A breakdown below the neckline often signals the end of an uptrend and the start of a bearish move.
- Double Tops/Bottoms: A double top forms when price fails to break above a resistance level twice, suggesting weakening bullish momentum. A double bottom indicates strong support after two failed attempts to push lower, often preceding a rally.
- Triangles (Symmetrical, Ascending, Descending): These consolidation patterns form when price ranges narrow between converging trendlines. Symmetrical triangles indicate market indecision, while ascending triangles (with rising lows) often resolve upward, and descending triangles (with lower highs) tend to break down.
Applying these patterns to historical WTI charts can help traders anticipate turning points. For instance, a confirmed head and shoulders breakdown in 2014 preceded a major leg down in oil prices, aligning with broader fundamental deterioration.
Integrating Fundamental and Technical Analysis
The most effective WTI analysis blends technical and fundamental perspectives. While technicals reveal timing and price levels, fundamentals explain the underlying drivers.
For example, if the EIA reports a larger-than-expected crude inventory build, the fundamental outlook turns bearish. A technical analyst would then look for confirmation—such as a break below a key support level or bearish divergence in the RSI—to time a short entry. Conversely, strong global growth data might support higher oil demand. If this coincides with a bullish breakout from a multi-week triangle pattern or a golden cross (50-day MA crossing above 200-day MA), the case for a long position strengthens significantly.
WTI Charts for Different User Profiles
The way WTI charts are used varies by audience and objective:
- Short-Term Traders: Focus on intraday charts (1-minute to 1-hour) to exploit volatility. They rely heavily on technical indicators, volume patterns, and news catalysts—such as EIA inventory reports—to enter and exit positions quickly. Precision and speed are key.
- Long-Term Investors: Prefer weekly or monthly charts to identify macroeconomic trends and cyclical turning points. Their decisions are guided more by long-term factors—like OPEC+ policy shifts, global energy transition trends, and economic cycles—often investing through oil ETFs or energy stocks rather than direct futures.
- Businesses (Producers, Refiners, Airlines): Use WTI charts primarily for risk management. By analyzing futures curves and historical volatility, they hedge future production or fuel needs, locking in prices to protect margins. Their strategies balance market data with operational realities.
Conclusion: Navigating the Dynamics of WTI Crude Oil
WTI crude oil charts are far more than simple graphs—they are dynamic narratives of global energy economics. They reflect the interplay of supply and demand, the weight of geopolitical uncertainty, the influence of monetary policy, and the psychology of market participants. Whether you’re interpreting a candlestick pattern, comparing WTI to Brent, or analyzing the impact of an EIA report, a well-rounded understanding of these charts is essential. The energy market will continue to evolve, shaped by technological innovation, environmental policies, and unforeseen global shocks. Success in this space demands not only technical proficiency but also a deep awareness of the forces driving price movements. With disciplined analysis and a strategic mindset, traders, investors, and businesses can turn WTI charts into powerful tools for decision-making.
Frequently Asked Questions about WTI Charts
What is the difference between WTI and Brent crude oil?
WTI (West Texas Intermediate) is a light, sweet crude primarily produced and priced in the U.S., delivered to Cushing, Oklahoma. Brent crude is also light and sweet but originates from the North Sea and is a global benchmark, easily transported by sea. WTI is generally considered higher quality due to lower sulfur content, but their price differential fluctuates based on regional supply/demand, infrastructure, and global accessibility.
Where can I find reliable live WTI crude oil charts?
Reliable live WTI crude oil charts can be found on major financial news websites like Reuters and Bloomberg, and dedicated charting platforms such as TradingView or Investing.com. These platforms offer real-time data, customizable indicators, and various chart types.
What factors primarily drive WTI crude oil prices?
WTI crude oil prices are primarily driven by a combination of:
- Supply and Demand: Global oil production (OPEC+, US shale), inventory levels (EIA, API reports), and consumption patterns (economic growth, industrial activity).
- Geopolitical Events: Conflicts, instability, and sanctions in major oil-producing regions.
- Economic Indicators: Global GDP growth, inflation, interest rates, and the strength of the US dollar.
- Market Sentiment: Speculation and futures trading activities.
How do I interpret WTI futures contract symbols?
WTI futures contracts on NYMEX typically use the symbol “CL,” followed by a single letter for the expiration month and a number for the year. For example, “CLG24” signifies a WTI futures contract expiring in February (G) of 2024. Common month codes range from F (January) to Z (December).
What is Cushing, Oklahoma’s significance to WTI prices?
Cushing, Oklahoma, is a major oil storage and pipeline hub in the U.S. It serves as the physical delivery point for NYMEX WTI futures contracts. The inventory levels and pipeline capacity at Cushing directly influence WTI spot prices, with high storage levels often indicating oversupply and downward price pressure, as famously seen during the negative prices in April 2020.
Can WTI charts predict future oil prices accurately?
WTI charts are powerful tools for analysis, identifying trends, and understanding past price movements, but they cannot predict future prices with absolute accuracy. They provide probabilities and insights based on historical patterns and current market data. Combining technical analysis with fundamental factors offers a more robust forecasting approach.
How do EIA inventory reports affect WTI crude oil charts?
The EIA Weekly Petroleum Status Report, released every Wednesday, provides crucial data on U.S. crude oil inventories. A larger-than-expected build in crude inventories typically signals weaker demand or stronger supply, exerting downward pressure on WTI prices. Conversely, a significant draw (decrease) in inventories suggests stronger demand or tighter supply, often leading to price increases. These reports frequently trigger sharp, short-term volatility on WTI charts.
Is WTI a good investment for beginners?
Direct trading of WTI futures contracts is generally considered high-risk and complex, making it unsuitable for most beginners. Oil markets are highly volatile and influenced by numerous global factors. Beginners interested in exposure to crude oil might consider lower-risk options like energy sector ETFs (Exchange Traded Funds) or mutual funds, which offer diversification and professional management.
What are the typical trading hours for WTI futures?
WTI crude oil futures on NYMEX (CME Group) trade nearly 24 hours a day, five days a week. The typical trading hours are from Sunday 6:00 p.m. ET to Friday 5:00 p.m. ET, with a daily maintenance break from 5:00 p.m. ET to 6:00 p.m. ET. This extensive trading window allows participants from various time zones to access the market.
How can geopolitical events impact WTI charts?
Geopolitical events, such as conflicts, political instability, or sanctions in major oil-producing regions, can significantly impact WTI charts by creating uncertainty around supply. Fears of supply disruptions can cause immediate price spikes, increased volatility, and shifts in market sentiment. Even perceived threats to supply lines or production facilities can lead to rapid upward price movements.
發佈留言
很抱歉,必須登入網站才能發佈留言。