XAU Components: Understanding the PHLX Gold and Silver Sector Index
Welcome, future financial experts and curious investors! Today, we embark on a journey into the fascinating world of precious metals mining stocks, specifically focusing on a key benchmark index: the PHLX Gold and Silver Sector Index, or ^XAU. If you’ve ever wondered about the forces that move the shares of companies digging for gold and silver, you’re in the right place. We’ll decode the ^XAU index, look closely at the companies that make it up, analyze their recent performance, and perhaps most importantly, understand the powerful external factors – from central bank decisions to global tensions – that shape their fortunes.
• The ^XAU index serves as a benchmark for the health of gold and silver mining companies.
• It allows for broad exposure to the sector without needing to analyze individual companies.
• Investors can gain insights on market trends by tracking the index’s performance.
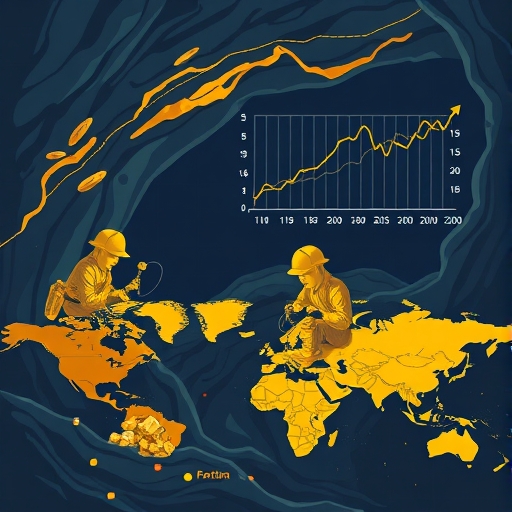
So, what exactly is the PHLX Gold and Silver Sector Index (^XAU)? Think of it as a specialized basket designed to hold the stocks of major companies involved in the gold and silver mining industry. When you look at the ^XAU, you’re essentially getting a snapshot of the collective health and performance of this specific part of the market. It’s like a barometer for the precious metals mining sector.
Indices like the ^XAU serve a crucial purpose for investors. They provide a benchmark against which individual mining stocks can be compared, and they allow investors to gain broad exposure to the sector without having to pick and analyze dozens of individual companies themselves. An index fund or ETF tracking the ^XAU, for example, would hold shares in the constituent companies roughly in proportion to their weighting in the index.
Understanding indices is fundamental to navigating the stock market, regardless of whether you’re interested in technology, energy, or, in our case today, non-energy minerals like gold and silver. By tracking the index, you can gauge the overall trend and sentiment in the sector. Is the index rising? That suggests the sector is generally performing well. Is it falling? Perhaps the sector faces headwinds.
Just like a country’s economy is made up of many different businesses, the ^XAU index is composed of a specific list of companies. These companies are primarily engaged in the business of mining gold and silver, although some may have diversified interests or operate on a royalty basis. The data we have indicates the ^XAU includes a diverse group, classified under the “Non-energy minerals” sector – a fitting description for companies extracting valuable materials from the earth that aren’t coal, oil, or natural gas.

The specific list of constituent companies can change over time, reflecting shifts in market capitalization, liquidity, or business focus. Our data points to a significant number of companies within the index, each with its own unique profile. You’ll find names that are global giants alongside smaller, more focused operations. Some key players mentioned in the data include:
- Newmont Corporation (NEM)
- Freeport-McMoRan Inc. (FCX)
- Agnico Eagle Mines Limited (AEM)
- Wheaton Precious Metals Corp. (WPM)
- Barrick Gold Corporation (GOLD)
- Franco-Nevada Corporation (FNV)
And many others, such as Agnico Eagle Mines (AEM), Gold Fields (GFI), Kinross Gold (KGC), Pan American Silver (PAAS), Hecla Mining (HL), and many more, totaling over two dozen companies. Each of these companies contributes to the overall movement of the index based on its weighting, which is typically determined by its market capitalization. Larger, more valuable companies tend to have a greater impact on the index’s performance.
The fact that all these companies are categorized under “Non-energy minerals” highlights their shared industry focus. While Nasdaq and other data providers classify them this way, it’s important to remember that within this category, there are nuances. Some companies primarily mine gold, some silver, and some a mix. There are also royalty and streaming companies (like Wheaton Precious Metals or Franco-Nevada), which don’t operate mines themselves but provide financing to miners in exchange for a percentage of future production or revenue. These different business models can affect their risk profiles and how they react to commodity price changes.
Understanding who is in the basket is the first step to understanding how the basket behaves. Each company brings its own operational strengths, geographic exposure, and financial health to the mix, all of which collectively influence the ^XAU index.
To truly understand the companies within the ^XAU index, we need to look beyond just their stock prices. Financial data provides deeper insights into their valuation, profitability, and stability. The provided data highlights the availability of several key metrics for these components, essential tools for fundamental analysis. Think of these metrics as vital signs for a company’s financial health.
| Metric | Description |
|---|---|
| Market Capitalization: | This is the total value of a company’s outstanding shares (share price multiplied by the number of shares). |
| Price: | The current trading price per share. |
| Change %: | The percentage change in the stock price over a specific period (e.g., a day). |
| Volume: | The number of shares traded during a specific period. |
| P/E Ratio: | This metric compares a company’s share price to its earnings per share. |
| EPS: | This is a company’s profit divided by the number of outstanding shares. |
| Dividend Yield %: | The annual dividend payment per share divided by the share price, expressed as a percentage. |
Examining these metrics for each XAU component provides a much richer picture than just looking at price movements. It helps you understand if a company is profitable (EPS), how the market values that profitability (P/E), and if it returns value to shareholders through dividends (Dividend Yield). For instance, even if a stock price is falling, a healthy EPS and a reasonable P/E might suggest the downturn is sector-wide or temporary, rather than indicative of company-specific fundamental issues. Conversely, rising prices with negative EPS could be a red flag.
These data points, readily available from financial sources like Nasdaq and FactSet (as noted in our source), are the building blocks for conducting fundamental analysis on the constituents of the ^XAU index. They allow investors to go beyond just technical charts and understand the underlying business value.
Now, let’s shift our focus to the immediate pulse of the market for these mining stocks. Our analysis of the recent trading data paints a clear picture: a prevalent negative performance trend among XAU components. While the index itself tracks the average, looking at individual components reveals that most stocks experienced declines in their price percentage change during the snapshot of data we reviewed.
This widespread negative movement suggests that recent market forces were broadly unfavorable to the sector. It’s rare for all stocks in an index to move in perfect lockstep, but when a strong majority show declines, it points to sector-wide pressures rather than isolated company issues. Several stocks stood out with notable declines, including Hecla Mining (HL), Seabridge Gold (SA), and Coeur Mining (CDE).
What could explain this widespread decline? While individual company news always plays a role, when the trend is sector-wide, we need to look at the bigger picture. This recent performance snapshot serves as a stark reminder that even in a sector potentially supported by long-term trends (like rising gold prices, which we’ll discuss), short-term market volatility and sentiment can lead to price drops across the board. It highlights the importance of understanding the macroeconomic and geopolitical factors that influence the entire precious metals complex, as these often dictate the sector’s broad movements.
For investors, observing such a trend prompts questions: Is this a temporary dip, or the start of a more significant downturn? Is it driven by commodity prices, or other market forces? This is where linking performance data with the external factors becomes crucial. Understanding *why* stocks are falling helps you differentiate between a potential buying opportunity and a signal to be cautious.
The stock market, after all, is a complex system where individual company performance, sector trends, and global events all interact. The recent decline in many XAU components is a data point that requires further analysis, particularly in the context of the external forces acting on the precious metals market, which we will explore next.
The price of gold and silver, and consequently the performance of mining companies that produce them, are highly sensitive to macroeconomic conditions, particularly those related to monetary policy and currency strength. Our data specifically highlights two critical factors: expectations surrounding the Federal Reserve’s monetary policy and the strength of the US Dollar.
First, let’s consider the Federal Reserve (the U.S. central bank) and its monetary policy. The Fed influences borrowing costs through setting interest rates. When interest rates are high, holding non-yielding assets like gold becomes less attractive compared to interest-bearing assets like bonds or savings accounts. Why? Because you miss out on the higher interest income you could be earning elsewhere. This is known as opportunity cost. Conversely, when interest rates are low or expected to fall, the opportunity cost of holding gold decreases, making it more attractive. This is why Nasdaq’s data mentions that “Bets that the Federal Reserve (Fed) would lower borrowing costs further in 2025 contribute to driving flows towards the non-yielding Gold price.” Expectations of future rate cuts act as a potential tailwind, supporting gold prices and, by extension, the companies that mine it.
Second, there’s the US Dollar (USD). Gold is typically priced in US Dollars globally. This creates an inverse relationship between the strength of the USD and the price of gold. When the US Dollar strengthens, it takes fewer dollars to buy an ounce of gold, potentially pushing the dollar price of gold down (assuming other factors are constant). Conversely, a weaker US Dollar makes gold cheaper for holders of other currencies, increasing demand and potentially pushing the price up. Our data notes that “a goodish US Dollar (USD) recovery from the lowest level since March 2022 keeps a lid on any further appreciating move for the bullion.” This indicates that while rate cut expectations provide support, a strong USD acts as a headwind, potentially capping how high gold prices can go.
| Factor | Impact on Gold Prices |
|---|---|
| Lower Interest Rate Expectations | These support gold prices by reducing the opportunity cost of holding gold. |
| US Dollar Strength | A strengthening USD can cap gold’s upward movement or even push its price down. |
| Geopolitical Tensions | Events that increase demand lead to spikes in gold prices. |
Imagine you’re buying something priced in a foreign currency. If your home currency gets stronger, that item effectively becomes cheaper for you. The same principle applies to gold for investors using currencies other than the USD. But for USD holders, a stronger dollar means gold becomes relatively more expensive compared to other USD-denominated assets or commodities. So, a rising USD can dampen demand and limit price increases.
These two factors – monetary policy expectations and currency strength – are powerful forces that investors in the precious metals sector must constantly monitor. They provide context for understanding broad price movements in gold and silver, which in turn significantly impact the revenue and profitability of mining companies. Economic data releases, such as the Producer Price Index (PPI) and Consumer Sentiment Index mentioned in the data, are key indicators that influence expectations about future Fed policy and the direction of the USD. A muted PPI, for example, could reinforce the case for future rate cuts, while strong consumer sentiment might suggest the economy is robust enough that the Fed might delay easing.
Beyond macroeconomic numbers, the performance of gold and, consequently, gold mining stocks is heavily influenced by global stability – or lack thereof. Gold has historically been considered a “safe-haven” asset. This means that in times of economic uncertainty, political instability, or escalating conflict, investors often flock to gold as a store of value that is expected to retain its worth better than other assets like stocks or bonds, which might be more vulnerable to market turmoil.
Our provided data underscores the critical role of geopolitical tensions, specifically highlighting the conflict between Israel and Iran, as a significant driver for safe-haven demand. The report notes that actions like Israel launching “pre-emptive airstrikes against Iran” and the subsequent potential for “retaliatory action” and a “region-wide and more devastating war” immediately lift the safe-haven demand for gold. This is a direct cause-and-effect relationship often observed in financial markets.
Why does conflict boost gold? In times of crisis, there is a flight to safety. Investors become risk-averse. They worry about the stability of financial systems, the value of currencies, and the impact of conflict on global trade and economic growth. Gold, with its long history as a medium of exchange and store of value, is perceived as a reliable asset outside of the traditional banking system and the control of individual governments. It’s a tangible asset that doesn’t rely on a company’s profitability or a government’s solvency.
The escalating rhetoric and military actions described in the data – such as Iran’s Supreme Leader vowing “severe punishment” – heighten the sense of uncertainty and risk. This elevated risk environment makes safe havens more appealing. While expectations of interest rate cuts provide a fundamental pull for gold by lowering opportunity cost, geopolitical tensions often provide the immediate, sharp catalyst for price spikes by triggering urgent safe-haven buying.
Think of it like this: Interest rate expectations are like the slow, steady tide pushing a boat. Geopolitical crises are like sudden, powerful waves. Both affect the boat’s position, but the waves can cause rapid and dramatic movement. For gold mining companies, a sudden surge in the price of the commodity they produce directly impacts their potential revenues and perceived value, even if their operational costs remain stable. This is why monitoring global political developments, especially in volatile regions, is as crucial for gold investors as understanding economic indicators.
The interplay between fundamental economic factors (like interest rates and the USD) and sudden geopolitical shocks makes the precious metals market, and therefore the ^XAU index, particularly dynamic and sometimes unpredictable. Investors must be prepared for the impact of both slow-moving economic trends and rapid-onset global events.
We’ve discussed the individual external forces: the prospect of lower interest rates, the strength of the US Dollar, and the impact of geopolitical tensions. Now, let’s put it together and see how these factors directly influence the performance of the companies within the ^XAU index.
Remember, the core business of these companies is mining and selling gold and silver. Their revenues are directly tied to the prices they can get for these metals on the global market. So, when the price of gold or silver rises, it tends to be good news for miners. Assuming their costs of extraction remain relatively stable, a higher selling price leads to wider profit margins. Conversely, when metal prices fall, margins can shrink, or companies might even face losses, especially those with higher operating costs or lower-grade ore bodies.
Therefore, the macroeconomic and geopolitical factors we discussed filter down to the mining companies primarily through their impact on commodity prices:
- Lower Interest Rate Expectations: These support gold prices by reducing the opportunity cost of holding gold. Higher gold prices mean more revenue potential for miners, acting as a tailwind for their stock prices.
- US Dollar Strength: A strengthening USD can cap gold’s upward movement or even push its price down, especially for dollar-denominated prices. This can negatively impact the revenue outlook for miners, acting as a headwind for their stocks.
- Geopolitical Tensions & Safe-Haven Demand: These events cause surges in gold prices due to increased demand. This is typically a very positive, albeit sometimes temporary, boost for mining company valuations as their primary product suddenly becomes more valuable.
Consider a company like Newmont (NEM) or Barrick Gold (GOLD). Their profitability is highly leveraged to the price of gold. A 10% rise in gold price doesn’t just mean 10% more revenue; it can mean a much larger percentage increase in profit, especially if they have fixed costs of production. This sensitivity is why mining stocks often act as a leveraged play on the underlying commodity price. When gold moves, they often move more dramatically, both up and down.
The recent negative performance trend we observed in many XAU components suggests that despite the potential long-term tailwinds (like future rate cuts or persistent geopolitical risk), the immediate pressures, perhaps from a recovering USD or short-term market sentiment shifts unrelated to fundamentals, were dominant during that specific period. This highlights the complex and sometimes conflicting forces at play.
Understanding this direct linkage between commodity prices and miner profitability is key to analyzing XAU components. It’s not just about the companies themselves; it’s also about the market for what they produce. This is where linking technical analysis (looking at stock charts) with fundamental and macroeconomic analysis becomes incredibly powerful.
We touched upon fundamental metrics like P/E, EPS, and Dividend Yield earlier. Let’s revisit them specifically in the context of mining companies within the ^XAU index. While these metrics are standard across industries, their interpretation can have nuances in the cyclical and capital-intensive mining sector.
| Metric | Context in Mining |
|---|---|
| Earnings Per Share (EPS): | For mining companies, EPS is sensitive to commodity prices. Sharp rises or falls in gold or silver can impact earnings dramatically. |
| P/E Ratio: | P/E ratios can look high when earnings are depressed by low commodity prices, while low P/E may occur during peak prices. |
| Dividend Yield: | Dividend policies can vary; established firms might link dividends to commodity prices, while others may reinvest profits. |
Understanding these metrics requires context. For example, seeing a company with a high P/E might not automatically mean it’s overvalued if the market anticipates a significant rise in gold prices that will boost future earnings dramatically. Similarly, a low P/E could just indicate that current earnings are unsustainably high due to a temporary commodity price spike. This is where experience and specialized knowledge in the sector become invaluable.
Analyzing these fundamental metrics, combined with an understanding of the company’s operations, reserves, production costs, and management, allows for a more complete picture of the investment opportunity beyond just tracking the ^XAU index price. Data providers like Nasdaq, FactSet, and Refinitiv are essential resources for obtaining this detailed financial data.
So, what does the future hold for the companies that make up the ^XAU index? Based on the factors we’ve discussed, the outlook is shaped by a fascinating interplay of potentially conflicting forces. On one hand, there are significant tailwinds supporting the sector, while on the other, certain factors act as headwinds.
The primary potential tailwind identified in the data is the expectation of Federal Reserve interest rate cuts in 2025. As we’ve seen, lower interest rates reduce the opportunity cost of holding gold, making it more attractive as an investment. This expectation alone can drive investment flows into the precious metals market, supporting gold prices. If gold prices rise as a result, the profit potential for mining companies increases, which should theoretically support their stock valuations. The note about the “fundamental backdrop seems tilted in favor of the XAU/USD bulls” from one source reinforces this idea that underlying conditions could be supportive.
| Potential Tailwinds | Potential Headwinds |
|---|---|
| Expectations of lower interest rates | Recovery of the US Dollar from recent lows |
| Elevated geopolitical tensions | Higher operational costs due to inflation |
Furthermore, the persistence of elevated geopolitical tensions, particularly highlighted by the Israel-Iran conflict, provides ongoing support for safe-haven demand. As long as global instability remains a concern, investors are likely to retain an allocation to gold as a hedge against uncertainty. This sustained demand provides a floor under gold prices and can lead to upward spikes during periods of heightened tension. This is a powerful, albeit unpredictable, driver for the sector.
However, the sector also faces headwinds. The recovery of the US Dollar from its recent lows is explicitly mentioned as a factor that “keeps a lid on any further appreciating move for the bullion.” A stronger USD makes gold more expensive for international buyers and can lead to selling pressure. This currency dynamic acts as a counterweight to the positive forces from rate cut expectations and safe-haven demand.
Moreover, while we focused on external factors, the outlook for individual XAU components also depends on company-specific issues: production levels, costs, new discoveries, political risk in operating regions, and management effectiveness. A company with high costs and operational challenges might struggle even if gold prices are rising, while an efficient producer with new projects could thrive.
Therefore, the performance of the ^XAU index and its constituents in the coming months will likely be a delicate balance between these forces. Investors will need to monitor closely:
- Statements and actions from the Federal Reserve for clues on the timing and magnitude of potential rate cuts.
- Economic data releases (like inflation, employment, and sentiment) that influence Fed policy expectations.
- Movements in the US Dollar against major currencies.
- Developments in global hotspots and the broader geopolitical landscape.
- Company-specific news regarding production results, exploration updates, and financial performance.
Navigating this environment requires a nuanced approach, combining macroeconomic analysis with a deep dive into the fundamentals of the specific companies you’re interested in. It’s a complex puzzle, but one that offers potentially rewarding opportunities for those who can read the signals.
If you’re looking to apply these insights to your own trading strategy and explore markets like forex or other CFDs, having a reliable platform is essential. If you’re considering starting forex trading or exploring more CFD instruments, then Moneta Markets is a platform worth considering. It is based in Australia and offers over 1000 financial instruments, suitable for both beginners and professional traders.
In today’s fast-paced markets, timely and accurate information is paramount. The data analysis we performed relies heavily on information from various financial sources. Understanding where this data comes from and its reliability is crucial for any serious investor or trader.
Our source data points to several reputable providers: Nasdaq, FactSet, TradingView, Dow Jones, Lipper, and Refinitiv, among others like CoinDesk, Kraken, and Kantar Media (relevant perhaps for broader market sentiment or related asset classes). These organizations specialize in collecting, processing, and distributing financial data from exchanges worldwide.
Nasdaq, being the source for the index definition itself, plays a key role, offering various data services like GIDS (Global Index Data Service), GIW (Global Index Watch), and GIFFD (Global Index Fee & Fund Data). These services provide detailed information about indices, their components, weightings, and performance data, which is essential for building analytical models, managing portfolios, or simply staying informed.
It’s also important to be aware of data delays. Financial data feeds can be real-time, delayed (e.g., 15 minutes), or end-of-day. The type of data you use can significantly impact your analysis, especially for short-term trading strategies. For instance, relying on delayed data for high-frequency trading would be detrimental, whereas for long-term investment analysis, end-of-day data might suffice.
Understanding the data sources also speaks to the EEAT principle, particularly Authority and Trustworthiness. Data from established financial information providers like Nasdaq and FactSet is generally considered authoritative and trustworthy because they have robust processes for data collection, verification, and distribution. Relying on such sources ensures that your analysis is based on accurate and reliable information, adding credibility to your investment decisions.
For example, when we look at the P/E ratio or EPS for a company like Agnico Eagle (AEM), we trust that the figures provided by a reputable source like FactSet or Refinitiv are calculated correctly based on the company’s reported earnings and the market price. This trust in data integrity is fundamental to building sound financial models and making informed judgments about company valuation and sector performance.
As you delve deeper into technical analysis or explore different asset classes like currencies, accessing reliable data through your trading platform is crucial. When choosing a trading platform, Moneta Markets‘ flexibility and technological advantages are worth mentioning. It supports major platforms such as MT4, MT5, and Pro Trader, combining high-speed execution with low spread settings to provide a good trading experience.
Our data consistently classifies the ^XAU components under the “Non-energy minerals” sector. While this classification is technically correct, it’s worth exploring the nuances and why it’s important to view this sector through a specialized lens compared to other segments of the materials industry.
The broader materials sector typically includes companies involved in mining, refining, and processing raw materials. This can range from producers of basic chemicals, construction materials, containers and packaging, metals and mining (both energy and non-energy related), and paper and forest products. The “Non-energy minerals” sub-classification focuses specifically on companies that extract minerals like gold, silver, copper, iron ore, diamonds, etc. What sets the companies within the ^XAU apart is their primary focus on gold and silver, which have unique market dynamics driven by factors like their role as monetary assets, jewelry demand, industrial uses, and as a hedge against inflation and uncertainty.
Unlike industrial metals (like copper or iron ore) whose demand is primarily tied to economic growth and industrial production, gold and silver (especially gold) have a significant investment component driven by factors less directly related to the industrial cycle. This is why monetary policy, interest rate expectations, currency movements, and geopolitical risk play such a dominant role in precious metals prices, often more so than for other non-energy minerals.
Consider the difference between a copper miner and a gold miner. A copper miner’s fortunes are heavily tied to the health of the global construction and manufacturing sectors – if factories are humming and buildings are going up, copper demand is high. A gold miner, while also subject to operational factors, sees its revenue potential fluctuate significantly based on how investors and central banks view monetary policy, inflation, and global risk – factors that might have less direct impact on copper demand.
Therefore, while grouped under “Non-energy minerals,” it’s crucial to analyze ^XAU components with an understanding of the specific drivers of gold and silver markets. Their classification highlights they extract materials, but their market behavior is often distinct from other mining companies due to the unique characteristics of precious metals.
This specialized knowledge is part of what makes navigating the precious metals sector rewarding but also challenging. It requires looking beyond broad sector trends and understanding the specific supply-demand dynamics, investment flows, and psychological factors that influence gold and silver prices.
For serious traders and investors, combining different analytical approaches can provide a more robust framework for decision-making. When looking at ^XAU components, both fundamental analysis (examining company health and market drivers) and technical analysis (studying price charts and trading patterns) offer valuable insights.
Fundamental analysis, as we’ve discussed, involves understanding the company’s financials (P/E, EPS, etc.), its operations (production levels, costs), and the broader market factors influencing the price of the commodity it produces (interest rates, USD, geopolitics). This helps you determine the intrinsic value of the stock and understand *why* the price is moving.
Technical analysis, on the other hand, focuses on the *how* and *when* of price movements. Technicians study historical price data, trading volume, and chart patterns to identify trends, support and resistance levels, and potential buy or sell signals. They believe that all known fundamental information is already reflected in the price, and that patterns repeat over time due to market psychology.
For ^XAU components, integrating both approaches can be very powerful. For instance, fundamental analysis might suggest that gold prices are poised to rise due to increasing geopolitical tension and dovish central bank expectations. This provides a bullish long-term outlook for mining stocks. Technical analysis can then be used to identify specific entry and exit points for individual stocks or the ^XAU index itself. You might look for a stock breaking above a key resistance level on high volume, confirming the bullish fundamental outlook with technical momentum.
Conversely, if fundamental analysis reveals a specific company within the ^XAU is facing operational issues or has high debt, technical analysis might show the stock is underperforming its peers and breaking below key support levels. This combination would signal caution, even if the overall gold market is strong.
Furthermore, technical indicators like volume can corroborate fundamental analysis. If a mining stock is rising sharply on news of a major gold discovery (fundamental), confirming this price rise with unusually high trading volume (technical) strengthens the signal and indicates strong market conviction.
Using tools available on platforms like TradingView or through broker platforms (Moneta Markets supports MT4, MT5, and Pro Trader, which offer robust charting and technical analysis tools) allows you to apply these techniques. You can overlay fundamental events onto price charts, analyze how stocks react to economic data releases, and use patterns to inform your trading decisions.
For example, you could track the correlation between the ^XAU index chart and the spot gold price chart. You might notice that mining stocks tend to lead or lag gold prices at certain turning points. You could also use technical indicators like the Relative Strength Index (RSI) or Moving Averages on XAU component charts to identify overbought or oversold conditions within the broader fundamental trend.
Mastering this integration takes practice, but it provides a more complete picture than relying on either approach alone. It allows you to build conviction based on underlying value and market drivers (fundamental) while refining your timing based on price action and market sentiment (technical).
While gold and silver prices are undoubtedly the primary driver for ^XAU components, other factors also play a role. Our data points to some of these, such as broader market indices and trade policy, which provide additional context.
The performance of major market indices like the NASDAQ Composite (^IXIC), S&P 500 (^GSPC), and Dow Jones Industrial Average (^DJI) can sometimes influence mining stocks. In periods of broad market panic, correlations across assets tend to increase, meaning mining stocks might fall simply because the overall market is selling off, regardless of gold prices. Conversely, a rising tide in the general market can sometimes lift all boats, including mining stocks, even if precious metals aren’t the primary focus of the rally. This is related to overall investor risk appetite.
Trade policy, such as the US tariffs mentioned in the data (expanding steel tariffs, maintaining high tariffs on Chinese imports), can also have indirect effects. While not directly taxing gold or silver mining, trade tensions can impact global economic growth forecasts, supply chains, and inflation expectations. For example, tariffs can lead to higher input costs for mining operations or reduce demand for metals used in manufactured goods, even if those metals aren’t gold or silver. More significantly, trade wars can increase global uncertainty, which *does* feed into safe-haven demand for gold.
Moreover, the cost structure of mining companies is influenced by factors like energy prices (for operating machinery), labor costs, and the cost of materials and chemicals used in processing. Changes in global markets for these inputs can impact profitability, regardless of the price of the mined metal. While our provided data doesn’t detail these operational costs, they are a crucial element of a miner’s financial health.
Currency exchange rates are also relevant, even beyond the USD/Gold relationship. Mining companies operate globally. Their costs might be in one currency (e.g., Canadian Dollars for a Canadian miner, South African Rand for a South African miner) while their revenues are in USD. Fluctuations in these local currencies against the USD can significantly impact reported profits when translated back into USD or the company’s reporting currency. A weaker local currency relative to the USD can lower operating costs for a miner selling its product in USD, boosting profitability. Conversely, a stronger local currency can increase costs.
Considering these additional factors – broader market sentiment, trade policies, operational costs, and currency exchange rates – provides a more comprehensive view of the challenges and opportunities faced by the companies in the ^XAU index. They add layers of complexity to the analysis but are essential for a complete understanding.
Analyzing the PHLX Gold and Silver Sector Index and its components effectively requires more than just looking up stock quotes. It demands a certain level of expertise and an understanding of the specific dynamics of the precious metals market and the mining industry. This aligns perfectly with the EEAT principle we mentioned earlier – demonstrating Experience, Expertise, Authority, and Trustworthiness.
Expertise in this context means understanding:
- The unique role of gold as a monetary asset and safe haven.
- The relationship between interest rates, inflation, and precious metals prices.
- How currency movements, particularly the USD, impact commodity prices.
- The specific operational and financial characteristics of mining companies (exploration risk, production costs, reserve life, geopolitical risk in operating regions).
- How to interpret fundamental metrics like P/E and EPS within the context of a cyclical industry.
- The various business models within the sector (producers, royalty/streaming companies).
Authority comes from demonstrating this expertise through rigorous analysis based on reliable data sources. When an analysis points to the impact of Fed policy or geopolitical events on XAU components and backs it up with references to market data trends and established economic principles, it builds authority. Utilizing data from trusted providers like Nasdaq, FactSet, and Refinitiv reinforces this authority and trustworthiness.
Experience, of course, is gained over time by observing how these factors play out in real markets. An experienced analyst or investor has seen how precious metals react to different economic cycles, geopolitical crises, and shifts in monetary policy, building intuition and recognition of patterns.
Trustworthiness is built through consistent, transparent analysis that acknowledges complexities and potential risks, not just opportunities. It involves using accurate data, applying sound analytical principles, and being upfront about the factors influencing conclusions.
For investors, particularly those new to the sector or looking to deepen their understanding, seeking out authoritative sources and explanations is vital. This article, by explaining the core concepts and linking them to the data provided on ^XAU components and market influences, aims to provide a foundation built on expertise and reliable information. We strive to be a trustworthy guide in helping you understand these complex dynamics.
Whether you are exploring investment in mining stocks or looking to diversify with precious metals, understanding the underlying drivers discussed here is fundamental. And if you’re considering implementing strategies across various markets, finding a platform with strong regulatory backing and global access is key. If you are looking for a forex broker that offers regulatory protection and global trading capabilities, Moneta Markets has multiple international regulatory certifications including FSCA, ASIC, and FSA, and provides comprehensive support such as segregated client funds, free VPS, and 24/7 Chinese customer service, making it a preferred choice for many traders.
The PHLX Gold and Silver Sector Index (^XAU) serves as a vital barometer for the precious metals mining industry. Its components, a diverse group of companies involved in extracting gold and silver, are subject to a unique set of market forces.
We’ve seen how the performance of these companies is intrinsically linked to the prices of gold and silver, which are in turn heavily influenced by macroeconomic factors like Federal Reserve monetary policy expectations and the strength of the US Dollar. The prospect of lower interest rates acts as a potential tailwind by reducing the opportunity cost of holding non-yielding gold, while a strong USD can act as a headwind, capping price gains.
Furthermore, geopolitical tensions provide a powerful, often immediate, catalyst for safe-haven demand, boosting gold prices and supporting the sector. Events like the Israel-Iran conflict, highlighted in our data, underscore how global instability can directly impact the value of these mining companies.
Analyzing ^XAU components also requires a deep dive into fundamental metrics such as Market Cap, P/E, EPS, and Dividend Yield, interpreting them within the cyclical nature of the mining industry. Understanding these numbers, combined with insight into operational factors and broader market dynamics, provides a robust framework for evaluating individual companies.
While recent trading data showed widespread price declines among XAU constituents in the specific snapshot reviewed, the underlying fundamental and geopolitical landscape continues to offer potential support for the sector. The future performance of the index and its components will be a balance of these competing forces.
Ultimately, navigating the XAU landscape successfully requires staying informed, understanding the interplay of macroeconomic and geopolitical factors, conducting thorough analysis of individual company fundamentals, and potentially utilizing technical analysis to refine trading or investment decisions. By building a strong foundation of knowledge, based on reliable data and sound analytical principles, you can approach the opportunities and challenges in the precious metals mining sector with greater confidence.
xau componentsFAQ
Q:What influences the price of gold and silver?
A:The price is influenced by macroeconomic conditions, including interest rates and the strength of the US Dollar, as well as geopolitical tensions that drive safe-haven demand.
Q:What is the significance of the ^XAU index?
A:The ^XAU index serves as a benchmark for the health and performance of companies involved in gold and silver mining.
Q:How can investors analyze mining stocks?
A:Investors can analyze mining stocks through fundamental metrics such as P/E, EPS, and market capitalization, while also considering macroeconomic and geopolitical factors.
發佈留言
很抱歉,必須登入網站才能發佈留言。